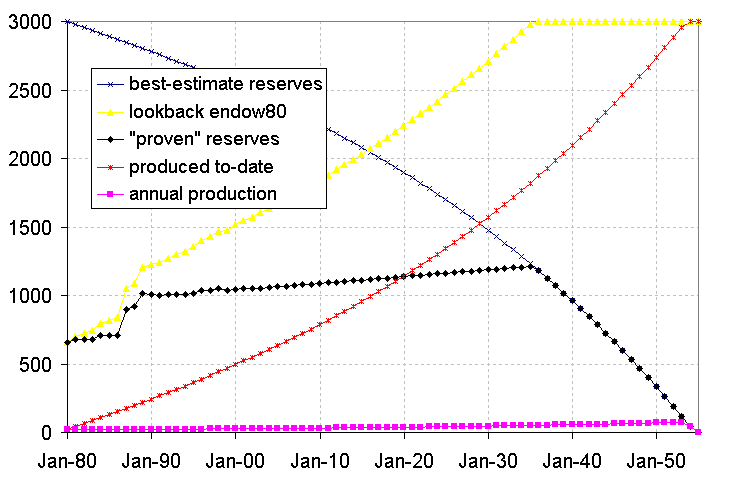
Figure 1: Oil Statistics, Low Scenario
Based on current projections, within something like 75 years, the world will have used up
For details on how this was calculated, see reference 1.
We should not expect a sudden transition from great abundance to complete exhaustion of these resources. Various more-gradual scenarios are more plausible, as discussed below. However, the straight-line analysis presented in reference 1 remains useful, because (among other things) it sets the timescale on which something big must happen.
There are various possible outcomes, all of which depend on the interplay of various factors:
Any combination of factors (A,B,C) promote the following results (1,2,3,4):
We should also consider the following:
For a discussion of the various types of estimates, see reference 2. The main types are
Scientific calculations should be done using the best available data. When it comes to estimating the amount of oil on earth, the “proven reserves” are not the best data.
Also, the reserves at the “current” time is not the most sensible way to approach the problem, because that will change as a function of time due to consumption if nothing else. Instead, it makes more sense to ask how much oil was on earth at a fixed epoch, e.g. 1950 or 1980. Call this the endowment at the specified epoch.
One would expect the proven reserves to increase over time, as more “proof” becomes available. But this does not mean the endowment is increasing. There is absolutely no reason to think any significant amount of oil is being created.
So the sensible approach is to establish a best estimate of the endowment. This estimate will be a probability distribution, with some width around a central value. There is no reason to expect the central value to change significantly as a function of time. As more evidence accumulates over time, the width of the probability distribution should decrease, and the central value will undergo a small random walk, but the central value should not exhibit any systematic drift. (If the central value does drift, it means you’ve been using unsound estimation procedures. You should be embarrassed. Go back to square one and re-do everything using sound estimation methods, so this problem never recurs.)
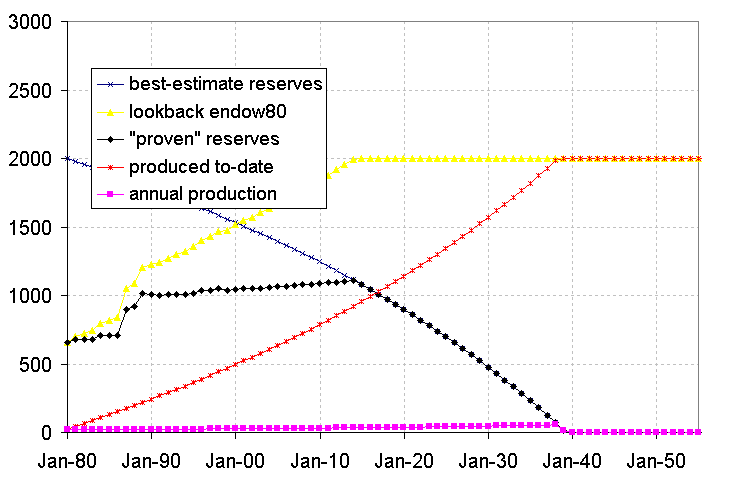
We can use figure 1 and figure 2 to get an idea of what might be going on. We do the analysis twice, because of the uncertainty in the endowment. For a summary of reported estimates, see reference 3. Quite a few authors favor a figure of about 2000 Gb (for the year 1980), although some estimates run as high as 3000 Gb or slightly higher. It is not entirely clear whether the disagreements stem from different interpretations of the same raw data (for instance, different decisions as to whether to include oil that is extremely hard to recover) or simply uncertainty in the raw data.
A huge jump in these “proven” reserves occurred in the late 1980s. This jump was not due to the creation of new oil molecules, nor even the discovery of hitherto-unexplored oil fields; instead it was a paperwork exercise carried out for political reasons. During a period of slack demand, OPEC members wanted to increase their claimed reserves in order to argue for larger OPEC production quotas.
In the “low scenario” as described in figure 1, in 1980 the earth had 2000 Gb of oil, of which only 1/3rd was classified as “proven” reserves. In 2003, the world had 1530 Gb of oil, of which 2/3rds was classified as “proven” reserves.
Despite the recent history of increases in “proven” reserves, it would be quite foolish to attempt to extrapolate such increases beyond the short-term future. Actual reserves are going down, even if “proven” reserves are going up in the short term. Proven reserves can never exceed 100% of actual reserves.
This section has analyzed the “proven” reserves of oil in some detail, partly because the oil industry seems so suffer the most from the “proven” reserves fallacy ... but similar thoughts apply to the total energy endowment. Coal will last longer than oil, but not a lot longer.
And as discussed in section 1, we do not actually expect current trends to continue until reserves crash to zero; we expect people to wise up and change their behavior before then.
We can predict with high confidence that something big will happen to overall energy usage in the next 75 years or less, and something big will happen to oil usage in the next 40 to 50 years or less. We cannot predict exactly what will happen, because the details depend on choices that have yet to be made.
As fossil fuels become depleted, there are basically only two choices: Either we do without energy (which doesn’t seem desirable), or we find renewable energy sources.
The “obvious” way to make electricity from sunlight is to use photovoltaic cells.
To make the US energy-sufficient, you would need to take an area half the size of Nevada and cover it with solar cells. This is a lot, but it’s not completely unreasonable. There are already huge areas devoted to food production; there’s no reason why we can’t devote a huge area to energy production.
Another option is to use solar-powered steam engines. This may seem low-tech, but it works better than you might have guessed. Pilot plants have been built.
A typical plant takes an indirect approach: Rather than using sunlight to produce steam directly, the sunlight is used to heat some molten salt, and then the hot salt is used to produce steam. This has the big advantage of allowing you to transport the energy across space and time.
If you believe my calculation based on US DOE numbers, the turbine approach compares favorably with the photovoltaic approach. The capital cost is lower, and it uses significantly less real estate. Indeed it is very nearly competitive with present-day wholesale electricity prices. But the DOE numbers may be misleading, because they don’t take into account the waste heat issues; there isn’t a lot of cooling water available in Nevada.
I don’t know how this will work out long-term. Steam-turbine technology is reasonably mature, so the costs should be fairly stable. Semiconductor technology is still progressing, so there is some hope that costs will come down quite a bit over time.
Electrical power is notoriously perishable. If you think it’s hard to sell day-old bread, try selling yesterday’s theater tickets, or yesterday’s electrical generation capacity. The existing electrical distribution infrastructure cannot store even one second’s worth of electrical energy.
It is expensive to store energy, but not impossible. One well known way is to used pumped hydropower; during times of excess supply water is pumped uphill using electrically-powered pumps, and then during times of excess demand the water is used to drive turbines and generators to reconvert the energy to electrical form. This is sometimes called secondary hydropower, in the same sense that a storage battery is called a secondary battery.
Sunlight is generally not available at night. This is a problem, because energy demand during the night is not zero. Therefore any system using photovoltaics would need unprecedented amounts of energy storage.
This is a serious problem, but perhaps not quite as serious as it might seem, because nocturnal energy demand can be reduced by cultural changes:
At some point you have to consider putting solar collectors in orbit, but this is still a long way from being feasible; see reference 5.
Solar power is not the only type of power to suffer from fluctuating availability. Wind power varies from minute to minute and from season to season, and primary hydropower is also somewhat seasonal.