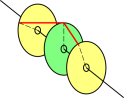
Figure 3: Phase : Load Sharing between Generators
Let’s talk about the physics and engineering of the North American electric power grid. Some useful notions and jargon can be found in appendix A.
As discussed in section 2, it is important to realize that there are several different feedback loops involved. They involve different physics, and have different roles to play in stabilizing (or destabilizing) the grid. These loops include
Let’s start by considering the phenomenon the industry calls “voltage stability” – or its opposite, “voltage collapse”. Voltage stability plays the role of keeping generator output in equilibrium with the load.
Consider the diagram in figure 1. It shows a generator (which includes some nonzero output impedance) driving a transmission network in series with the useful load.
              _________________
             |                 |
             |         output  Z
           -----    impedance  Z
            ---                |___________
           -----                   (A)     |
            ---                            Z
             |                             Z
             |                             |__________
             |                                (B)     |
             |                                        Z load
             |                                        Z impedance
             |________________________________________|

          (...    generator   ...) (transmission)   (load)
We would like this circuit to be stable. Specifically, we would like the voltage at points (A) and (B) to be well-behaved with respect to changes in the load impedance. For an ordinary voltage-divider made of resistors, stability would be guaranteed ... but the power grid is much more complicated.
A necessary condition for stability is that a reduction in voltage should result in a reduction in current. There are plenty of loads on the power grid that do not behave this way.
On top of all that, keep in mind that under conditions when lowering the voltage at point (B) results in unchanged power flow and therefore increase current flow past point (B), the power flow past point (A) actually goes up, because of increased I2R losses in the transmission impedance. Similarly whenever the load factor gets worse it increases the I2R losses.
As a result of all this, the generator could well be looking into a load that has a negative small-signal impedance. Actually the analysis is easier if we consider the Norton equivalent, namely figure 2, in which we speak of conductances instead of impedances. We care about the small-signal conductance, defined as G := ∂I/∂V (not I/V). Many people find zero conductance easier to think about than infinite impedance. Infinities are always annoying.
              _________________ _________ _________
             |                 |         |         |
             |                 |         |         |
  constant- ^^^        output  G         G         G
   current  ^ ^    conductance G         G         G
    source  ^^^                |         |         |
             |_________________|_________|_________|

      (...      generator     ...) (transmission) (load)
In some sense the easiest thing to think about is a zero-conductance load, which carries the same amount of current even if you vary the voltage. A slightly positive or slightly negative conductance isn’t much different from zero. The worst case is when the load conductance becomes so strongly negative that the parallel combination of the load and everything else becomes zero. In that case, the circuit becomes unstable: you have a constant-current source looking into zero conductance, which can’t be good. We see that a necessary condition for stability is to keep the generator’s output conductance sufficiently large to overcome whatever negative terms the rest of the circuit might contribute. (To say the same thing the other way: the generator needs to have a small output impedance.)
At the next level of detail, note that the I2R terms are nonlinear, so a large voltage swing at point (A) can lead to instability in cases where a smaller swing would not. According to reference 1, the First Energy system for years considered five-percent voltage swings to be the largest allowable, but at some point they decided to cut corners and allow ten-percent voltage swings, and this contributed to voltage collapse that was part of the 14-August-2003 blackout scenario.
Also the reactive I2R terms make a nonlinear contribution, so it is a good idea to keep them small (using capacitors or whatever). According to reference 1, First Energy didn’t do a very good job of that, either.
Of course the idea of negative conductance only applies to the small-signal conductance. In contrast, if you cut the customer’s voltage all the way to zero, then surely the current flow and power flow go to zero as well. So at some point, for abnormally large voltage swings, the system is stable. To say the same thing another way, rolling blackouts make more sense than brownouts.
Phase is used for balancing the short-term load-sharing between generators.
By way of analogy, suppose you have two horses harnessed to the same wagon. You want them to share the load. There is enough stiffness in the harness so that if one horse tries to get ahead of the other, it will take more than its share of the load. The horse will feel this instantly and will be retarded by the extra load.
The rotational version of this is shown in figure 3. There are three disks rotating coaxially CCW. The two outer disks (yellow) are generators. The middle disk (green) is the load. If the turbine driving the left-hand generator is a little friskier than the turbine driving the right-hand generator, the left one will become slightly advanced in phase and will take more of the load. Power is transferred to the load by rubber bands shown in red. You can see that the rubber band attached to the left disk has two advantages: is more stretched and has better leverage than the other one.
As you can see, this short-term load balancing is achieved by basic physics. No signaling network is required; the power lines themselves carry all the information that is needed. No governors or servos are involved. No software, no nuthin, just physics.
The same mechanism ensures that the two generators will remain synchronous. The phase signal that tells one or the other to pick up the slack involves a bounded amount of phase, so the long-term frequency is exactly the same for both generators.
This is of course related to the phase sensitivity discussed in section 2.2, but it is not a trivial corollary. It didn’t have to be that way. You could imagine other load-balancing schemes, such as two generators each coupled to the common load by a fluid clutch, so that they would share the load but not be synchronous.
Also, if the load mismatch becomes extreme, one generator could slip 2π of phase relative to the other. In the industry this is called “pole slip” and it is a Bad Thing for a number of reasons, including the fact that it puts large, rapidly-changing mechanical stresses on the generators.
The possibility of pole slip drives home the point that phase locking shouldn’t be taken for granted.
Let’s consider again what happens if the magnitude of the load increases. Conservation of energy tells us there are really only two possible responses: either reduce the load somehow, or increase the amount of power generated.
We saw in section 2.1 that reducing the load is not as simple as it sounds. And in any case customers more-or-less expect to be able to draw greater or lesser amounts of power at their discretion, and they expect the grid to accommodate this.
The grid is rigged up so that when the load increases, it causes all the generators to slow down. This is not just a phase shift with a bounded amount of phase as mentioned in section 2.2, but rather a full-blown frequency change involving an unbounded amount of phase.
This frequency change is detected (typically using the finest technology from the year 1788, namely a flyball governor) and that leads to the opening of the throttle on the turbine driving the generator, so that power production comes into equilibrium with the increased load.
Now here comes a slightly sneaky bit: you could imaging putting a PID (proportional/integral/differential) controller on each throttle to drive the frequency error right to zero, but that’s not what’s done! There is intentionally a system-wide (specifically, island-wide) frequency error, and that is used as a signal to all producers to increase their power output by a certain percentage of their capacity. This is called frequency droop. There is a system-wide agreement as to how each producer should respond to a given amount of droop. Without such an agreement, whoever had the least-droopy generator would wind up picking up all the variations in load for the entire island.
Again, this functionality is not entirely independent of the phase sensitivity discussed in section 2.2, but it’s not a direct corollary either. You could have had one without the other. Frequency droop depends on additional functionality in the throttle servos, and on agreed-upon semantics. The alternative would have been to use non-droopy servos ... plus some nice out-of-band signaling scheme to respond to changes in overall load.
The folks who own the generators can look at the volts and amps (or, analogously, the stretch and angle of the rubber bands in figure 3) and see how much power each one is generating. Then, depending on who wants to buy and who wants to sell, they can apply an upward or downward bias to the throttle settings on the turbines that drive the generators. This happens on a muuuuch slower timescale than the load-shifting mentioned in section 2.2 and the total power regulation mentioned in section 2.4.
Customers like to use the 60Hz power as a reference for timekeeping. The classic electric clock uses a synchronous motor.
This is possible because of yet another feedback loop, a very slow feedback loop implemented as follows: Grid operators count cycles. Every so often they compare this to official time signals, originally the Naval Observatory but nowadays just GPS. When the discrepancy starts getting too big, due mainly to the droop mentioned in item section 2.4, somebody sends out an AGC (automatic generator control) signal that tells everybody to bias their throttles a little bit to make up for lost time. There are also manual procedures for doing this. In any case, this happens on a much slower timescale than load-shifting (section 2.2 and total power regulation (section 2.4).
The clock error can be as much as ten seconds either way before they necessarily do anything about it. However, the long-term frequency and timekeeping should be excellent. The phase error is bounded, so the frequency error goes to zero if you wait long enough. Unless there is a blackout :-(.
On page 88 the report says “... many regions in the United States and Canada have eliminated the use of zone 3 relays on 230-kV and greater lines” which raises the question, if they can be eliminated, why were they installed in the first place?
Circuit breakers are important and necessary ... but they are not supposed to trip during routine, normal operations.
Also we should not fall into the trap of thinking that a circuit breaker is “the” solution to a problem, because typically there are multiple ways of solving any given problem, including more than one way to employ circuit breakers.
For example, consider a long transmission line. There are two basic ways in which it could become overloaded: (a) there could be a short to ground (e.g. due to contact between a tree and a sagging wire) or (b) it could be that the load at the downstream end is drawing too much power from the generators at the upstream end. These two cases are readily distinguishable: In case (a), there is a big discrepancy between the power entering upstream and power leaving downstream, while in case (b) there is not. It is important to make this distinction and respond accordingly. In case (a), you need to trip the breakers at both ends of the line. In case (b), in my opinion tripping those two breakers is generally not what you want, and should be done only as a last resort. The first resort should be to decrease the net demand imposed by the downstream subsystem, perhaps by increasing generation on the downstream side, or buying power through another link, or by shedding some percentage of the load (by blacking out selected customers).
This is important, because on 14 August 2003, the early stages of the blackout involved transmission lines tripping off line. (It was only in the later stages that generators tripped off.) Only one of these was due to a fault to ground; the rest were due to overloads. Every time a link tripped off, it increased the load on remaining links, leading to further overloads ... and you can easily see how a runway situation could result.
Similar remarks apply to the breakers that trip a generator off line in response to overload conditions. Overload could be manifested as overcurrent, undervoltage, or underfrequency. (One also needs to respond to overvoltage and/or overfrequency, but those are not typical of an overload situation, and are presumably less common.) When faced with an overload, the first response should be to throttle up other nearby sources and/or to buy power from more distant sources. The second response should be to shed some fraction of the load, by blacking out selected customers. Either of these first two responses leaves the remaining customers in better shape. The last resort is to trip the overloaded generator off line. This is better than allowing it to be damaged by the overload, but still it is a bad thing because it increases the load on the rest of the system, which is a recipe for a runway situation.
You don’t need to be a genius to see that the system was badly designed. It needed more actions that reduced real load, and fewer actions that reduced generation and transmission capacity.
Reference 1 has remarkably little to say about why the 14 August 2003 blackout lasted so long. There is a long discussion of how the blackout started, and a long discussion of how it spread, but almost nothing about how long it lasted, or why.
The report has only a handful of references to black-start capability, and most of those are merely a passing mention of generating plants that completely lack the capability.
I have seen many reports (e.g. reference 2) of subsystems that could not return to normal operation with stable voltage and frequency until they could tie into a larger, already-functioning grid. This seems like grounds for expecting larger and longer-lasting blackouts in the future. Long Island is literally and physically an island, and I don’t see why it wouldn’t have been possible to make it electrically an island, bring up the on-island generating capacity, and have most customers’ service restored within minutes. The switchgear needed to accomplish this presumably exists, and all that is lacking is the control network and planning necessary to use the switchgear effectively.
Similar remarks apply to Manhattan. I am particularly unimpressed by Con Edison’s policy of not accepting any responsibility for the blackout (reference 3). We agree that the blackout didn’t start in Con Ed territory, but Con Ed remains responsible for the fact that it spread into their territory. If they’d played their cards right, it wouldn’t have. They also remain responsible for the fact that customers were without service for periods ranging from 12 to 29 hours. Why couldn’t they have restored service within 29 minutes? Why did it take 29 hours?
The importance of black-start capability had been documented in industry “standards” for years before the 2003 blackout. Alas the industry has a track record of not adhering to its own “standards” as discussed in reference 1.
More generally, reading reference 1 creates the strong impression that the system contained many features that serve to minimize the number of small outages ... even though the same features increase the risk of large, long-lasting outages. I have no idea whether this is intentional ... I guess such a strategy would make sense if the penalty for a small outage was the same as the penalty for a huge outage.
One also gets the impression that many of the feedback loops and system protection mechanisms were both myopic and disproportionate. That is, when faced with a moderately bad situation, the mechanisms acted in such a way as to make the local situation moderately better while making the overall situation dramatically worse. This includes responding to a 10% overload on a major transmission cable by tripping off the entire cable, instead of shedding 10% or more of the downstream load. This happened repeatedly as the blackout was spreading.
It is sometimes argued that it is impossible to put intelligent (non-myopic) control systems into the power grid. This may have been mostly true at one time. It is an explanation (but not a justfication) for the sort of instability that allows blackouts to spread. In any case, it is much less true than it used to be; see section 6.
Reference 1 said “Some of NERC’s planning and operational requirements and standards were sufficiently ambiguous that FE could interpret them to include practices that were inadequate for reliable system operation.” The response to the 2003 blackout did not seem to bring much improvement in this regard. On 1 April 2005 NERC promulgated a black-start standard (reference 4), which requires only that the black-start plan meet the “expectations” of the regional system restoration plan. That strikes me as non-quantitative and remarkably open to interpretation.
I haven’t made an exhaustive study, but I haven’t seen anything that looks like an enforceable reliability standard, or a tangible reward for reliability, or a significant penalty for unreliability.
If I had to guess, I’d say there’s a high probability of another huge blackout within the next ten years. I’d estimate at 10% chance per year for each of the next several years.
Former Secretary of Energy Bill Richardson said the United States was “a major superpower with a third-world electrical grid”.
Electrical power is nearly 100% perishable on a rather short timescale. That is, there is rather little energy storage in the system. There is “some” storage in the form of kinetic energy in rotating machinery such as turbines and generators, but not enough to meet demand for longer than a fraction of a second.
At this point the story diverges. The old story is different from the new story.
| According to 20th-century conventional wisdom, load sharing (section 2.2) and voltage stability (section 2.1) must rely on basic physics, because there is no time for anything else. Similarly, because electricity travels at essentially the speed of light, there is a wide class of problems for which you cannot send any timely warning; the problem would arrive at least as soon as the warning. | On the other hand, there are more than a few problems for which timely warning is useful. According to reference 1, in many cases the blackout was spread by the action of zone-3 impedance relays, which act after a one- or two-second delay [ibid., page 88]. You can gather a lot of information from faraway places and do quite a lot of computing in one second. |
The 21st-century idea of a “smart grid” starts by placing syncrophasors in lots of places throughout the grid. In the context of power engineering, a syncrophasor measures the amplitude and phase of the voltage and/or current. The phase is measured relative to a well-defined standard, typically GPS. A new measurement is performed many times per second. The results are transmitted to one or more analysis sites.
Based on the analysis, the system can take various measures such as throttling generators, throwing switches in the distribution network, et cetera. This allows the system to respond to changing conditions, e.g. changes in supply (such as a cloud moving over a solar power farm), changes in demand, and changes in the distribution system (such as equipment failure, overheating, or whatever).
Syncophasors make it possible to make smart decisions, but they do not by themselves guarantee that smart decisions will be made. Actual smartness is required.
Along those lines: A faster feedback loop is “usually” more stable than a slow one, but stability cannot be taken for granted. A detailed stability analysis needs to be performed.
To make sense of reference 5, one needs to know some jargon and some background concepts: