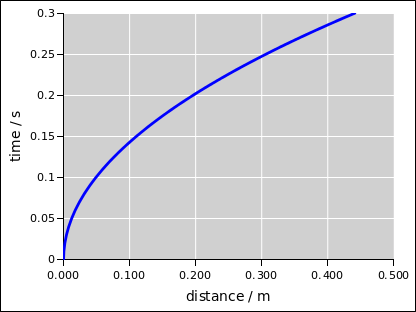
Figure 1: Setup for Simple Ruler Drop
Here is a simple way to measure reaction time.
People who have never seen a reaction-time measurement tend to be very surprised at how long reaction times really are.
The simple version of the experiment is remarkably simple. You need two people (one dropper and one catcher), plus a long ruler, plus a notebook (or computer) for recording the data.
The ruler should be a yardstick or meter stick; a 12” ruler is not long enough.
Here’s the procedure: The dropper holds the ruler, letting it dangle vertically. The catcher’s hand should be about chest high, with the ruler passing between the thumb and fingers as shown in figure 1. The thumb should be horizontal, so that the top of the thumb can be used as a reference. (This implies that the fingers will not be horizontal.)
Move the ruler and/or the hand so that the catcher’s thumb is aligned with a round number near the middle of the ruler – perhaps the 15 inch mark or the 50 cm mark.
The dropper releases the ruler without warning. The catcher then catches the ruler as quickly as possible. Record how far the ruler dropped.
In this situation, gravity is the only thing we need to worry about. (In principle there are corrections due to buoyancy, friction, etc., but the corrections are negligible.)
The ruler accelerates downward. The acceleration due to gravity is the same for everything. To a good approximation it is 9.8 meters per second per second, anywhere at or near the surface of the earth. That is to say, the speed is increasing at a steady rate. At the end of the first tenth of a second, the speed is 0.98 meters per second. A the end of the second tenth of a second, the speed is 1.96 meters per second. In all cases, the average speed (averaged over the whole motion) is half of the final speed. The distance traveled is the total time, multiplied by the average speed. Since the speed itself is proportional to time, the distance traveled is proportional to the square of the time. You can see some typical numbers in table 1.
| final | average | |||||||||||||||||||||||||||
|
|
|
|
|
| |||||||||||||||||||||||
| 0 | 9.8 | 0 | 0 | 0 | 0 | |||||||||||||||||||||||
| 0.05 | 9.8 | 0.49 | 0.245 | 0.0123 | 0.5 | |||||||||||||||||||||||
| 0.1 | 9.8 | 0.98 | 0.49 | 0.049 | 1.9 | |||||||||||||||||||||||
| 0.15 | 9.8 | 1.47 | 0.735 | 0.11 | 4.3 | |||||||||||||||||||||||
| 0.2 | 9.8 | 1.96 | 0.98 | 0.196 | 7.7 | |||||||||||||||||||||||
| 0.25 | 9.8 | 2.45 | 1.23 | 0.306 | 12.1 | |||||||||||||||||||||||
| 0.3 | 9.8 | 2.94 | 1.47 | 0.441 | 17.4 |
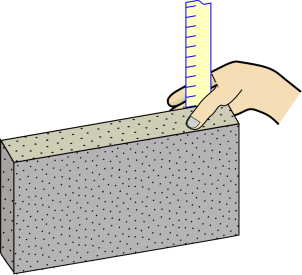
The relationship is plotted in figure 2.
We can express the same idea using equations:
| (1) |
where a is the acceleration, vfinal is the final speed, vavg is the average speed, d is the distance, and t is the time. We neglect friction and buoyancy, so the acceleration is just the standard acceleration of gravity.
Here are some refinements you can make:
Therefore, to get more consistent and reliable data, the dropper can hold the ruler in one hand and hold a piece of paper or cardboard with the other hand, so as to block the catcher’s line of sight. We want the catcher to have a good view of the ruler, but not of the dropper’s hand.
The point here is to level the playing field, so that the score means the same thing for all catchers, whether or not they know the trick about watching for hand movement.
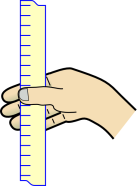
Therefore, to get more consistent and reliable data, use a different setup. Set a cinder block on a chair, slightly overhanging the edge. The catcher is seated in a nearby chair. Dangle the ruler next to the cinder block. The catcher is asked to trap the ruler against the side of the cinder block, as shown in figure 3.
This has a couple of advantages. For one thing, the block isn’t going to move up and down. Secondly, the top of the block provides a relatively clean reference line for reading the ruler.
As a general rule, excluding the results from “practice runs” must be done very carefully. Any time you exclude data from the analysis, you are changing the experiment. Beware that if this not done properly, it introduces nasty biases. In the ruler drop experiment, it helps to imagine we are doing two different experiments, measuring two different things, namely the reaction time of a naïve catcher and the reaction time of an experienced catcher.
However, in a classroom setting, it may be difficult to keep track of who is experienced and who is not, and it may be easier to just let each catcher practice a few times. When reporting the results, this should be clearly indicated, so that everybody knows what you measured.
It would be nice to measure the learning curve, but that is a more difficult experiment. It requires carefully keeping track of how much experience each catcher has, and then investigating reaction time as a function of experience.