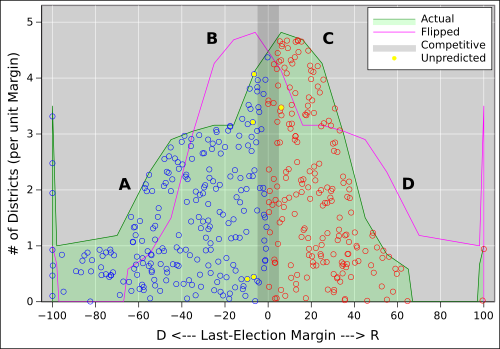
Figure 1: Distribution of House Districts
The US House of Representatives is quite grossly gerrymandered. Millions of voters get their votes stolen every time. Here is an explanation that may help you visualize gerrymandering, measure its effectiveness, understand how it works, and appreciate how it can sometimes go terribly wrong.
Effectiveness is discussed in section 1.1. The design principles used to create the effect are discussed in section 1.2. The geographic shape of the districts is discussed in section 1.4.
Let’s start by examining the effectiveness of gerrymandering. We shall see that it is very effective, resulting in millions of votes getting stolen every time there is an election for the US House of Representatives. Figure 1 is a good way to visualize the data.1
We can quantify this as follows: about 10% of all Democratic voters live in the competitive zone, whereas 12.5% of all Republican voters do. That’s not an accident. That corresponds to more than 3 million votes getting stolen.
In the 2018 election, D candidates outperformed the PVI by 5 points on average. However, this netted them only a small majority in the house, less than 1%, because of gerrymandering.
Everybody knows the objective of gerrymandering, namely to confer a partisan advantage. Similarly, everybody is aware that the mechanism involves shifting the district boundaries. However, let’s look at the next level of detail. How do the bad guys decide which boundaries they want to shift? In which direction? It turns out there is a fairly simple pattern they can follow.
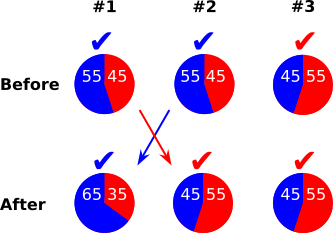
A simple example is shown figure 2. Blue is the majority party. Before gerrymandering, they have a reliable majority in 2 districts, while Red has a reliable majority in the third district.
For simplicity, imagine there are 100 voters in each district. So each voter is 1% of the total. The gerrymandering process moves ten red voters from district #1 to district #2, and replaces them by moving ten blue voters in the opposite direction.
Gerrymandering allows the minority party to win a majority of the races.
In general, the key idea is that votes are wasted in any district where there is a hyper-super-majority of one party or the other. In this simple example, it would be mathematically impossible for the Rs to win all three districts, so they pick one to use as a dumping ground for blue citizens whose votes they want to steal.
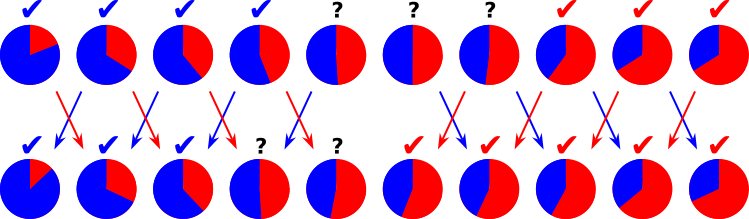
Figure 3 shows a fancier example, with ten districts. A clear pattern can be seen: all the red arrows point toward the middle, while all the blue arrows point toward the wings, in one direction or the other. (The same thing happens in figure 2, but the pattern is not quite so obvious there.)
The mechanism is now relatively easy to understand: Gerrymandering means blue voters are shifted to the wings, where their votes will be wasted. In exchange, red voters are shifted to the middle, where their votes help swing the election. (Strictly speaking it’s not the voters who move across boundaries, but rather boundaries that move, but it comes to the same thing.)
In figure 3, 6 of the 10 districts have red voters being transferred in and out at the same time. If you want the district to actually become redder, you need to adjust the size of the transfers so that more are transferred in than out. Otherwise the voters just get transferred through. This leaves the district unchanged, but is not futile, because it provides a means for transferring voters between non-adjacent districts.
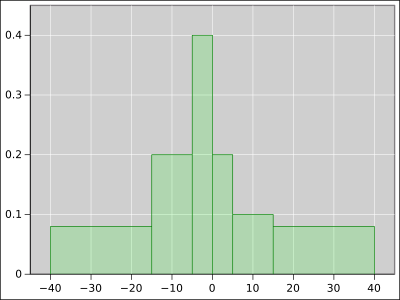
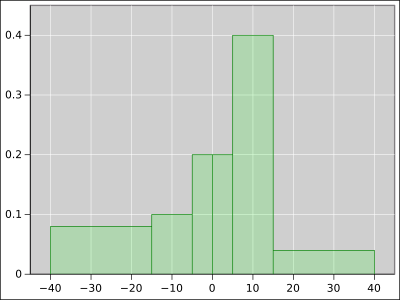
Figure 4 and figure 5 show the distribution for the ten-district example before and after gerrymandering.
Those who engage in gerrymandering run some huge risks. The loss of gerrymandering can cause loss of political control. Or vice versa. Or both, since there’s a feedback loop.
If for any reason the districts are redrawn to be less gerrymandered, the party that relies on gerrymandering will suffer staggering losses in the next election.
Conversely, if for any reason the gerrymanderers lose political power, they will have a hard time getting it back, because the other party will redraw the boundaries, either to make them neutral or to favor themselves.
There are multiple ways that the gerrymanderers could lose their grip on power. For one thing, the districts could get redrawn by court order, or in consequence of a ballot initiative, or some other process that bypasses the incumbent officeholders. Here’s another possibility that is even more interesting. A necessary byproduct of gerrymandering is that the distribution (e.g. figure 1 or figure 5) has a great many seats region just to the right of the competitive zone. Think about it: the whole idea is to create a bunch of districts that are just barely reliably red. If they are any redder than that, it means red votes are being wasted.
However, that is playing with fire. If it goes wrong, it will go wrong in spectacular fashion. If there is a slight shift in voter sentiment, perhaps due to a scandal or a policy mistake, then all the districts that used to be just-barely-safe become competitive. The opposition party can pick up a tremendous number of seats.
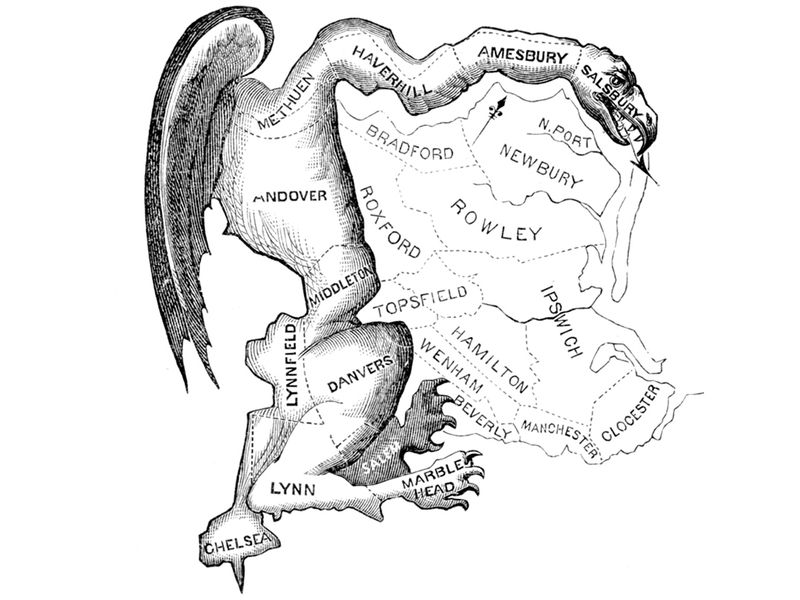
The term gerrymander is derived from the bizarre shapes that are sometimes given to gerrymandered districts. You can look at a district and say, wow, that’s really been gerrymandered.