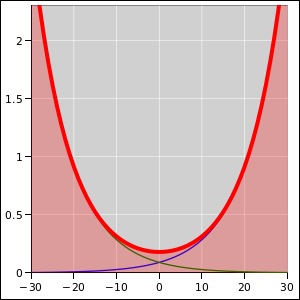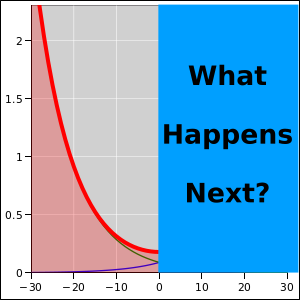
Figure 1: Can You Extrapolate? Can You Predict What Happens Next?
A lot of people find exponentials to be counterintuitive. For example, if you add an exponential with one rate to an exponential with the opposite rate, they do not average out. Really not.
You can practice by trying to extrapolate the red curve in figure 2. See if you can predict what happens next.
The answer is shown in figure 2.
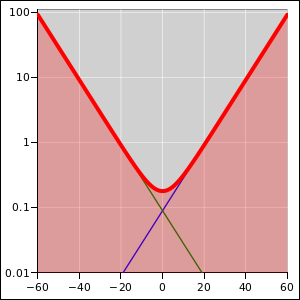
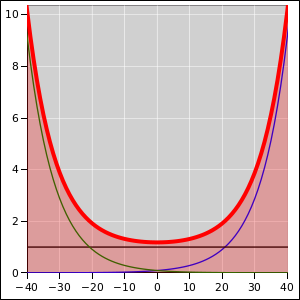
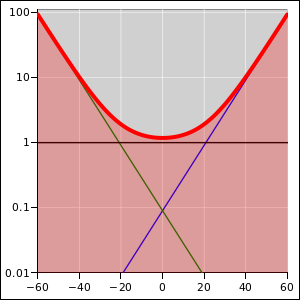
Let’s be clear: Figure 1 and figure 2 show the same data. In both figures, the red curve is the sum of the blue curve and the green curve, one of which started out large and decreasing, while the other started out small and increasing. The initially-small curve was negligible until all of a sudden it wasn’t. Figure 3 shows the same data again, using a log axis for the ordinate.
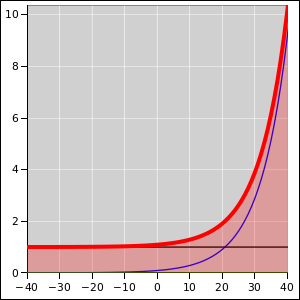
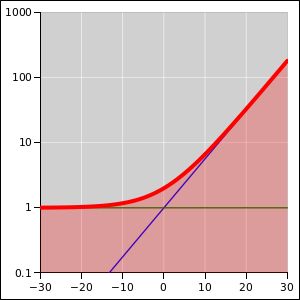
Figure 4 shows what happens when there is no decreasing curve; instead we have a constant contribution, shown by the black curve. The story is similar: The initially-small curve was negligible until all of a sudden it wasn’t. Figure 5 shows the same data on semi-log axes. Each of the asymptotes is a straight line when plotted this way.
Figure 6 and figure 7 show what happens when we have three exponentials, one with a negative growth rate (shown in green), one with a zero growth rate (shown in black), and one with a positive growth rate (shown in blue).
This is relevant to the coronavirus situation, because we don’t have one big outbreak. Instead we have hundreds of smaller outbreaks:
For these reasons, it is arrant madness to try to predict what happens next based on the shape of the overall curve, on a nationwide, statewide, or even countywide basis. To properly model what’s going on, you would have to use a super-fine-grained detailed model.
And that’s not worth the trouble, because all the honest models — including the simplest ones as well as the fanciest ones — are telling us the same thing. And that agrees with what we already know, based on recent history in countries that have been successful.
We need high-quality readily-available PPE. We need comprehensive, reliable, timely testing. We need contact-tracing and lots of it. We need facilities for isolating people who might be contagious, so we don’t have to isolate everybody else. The idea is to pounce on each little micro-outbreak before it gets big enough to show up in any statistical summary. Every country that has been successful has done it this way. For more on this, see reference 1.
All this has been obvious since February. Here we are many months later. The fact that these measures are not already in place is beyond scandalous, beyond outrageous, beyond criminal.