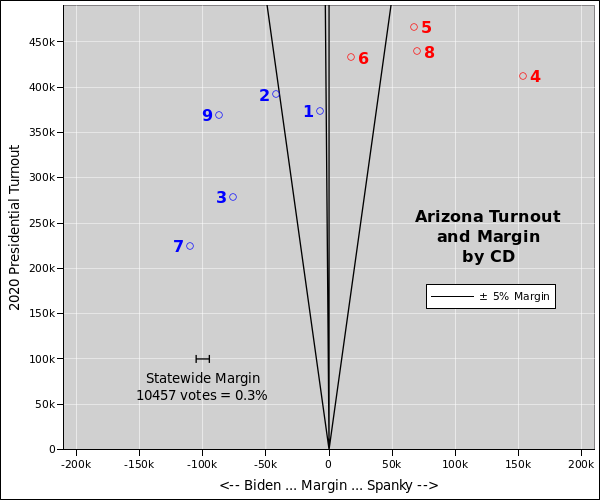
Figure 1: Turnout and Margin
Figure 1 shows the total turnout for the 2020 presidential race, as a function of the vote margin (R−D), broken down by congressional district, for the 9 CDs in Arizona. The black lines represent percentage margin: −5%, -0.3%, 0%, and +5%.
One thing that leaps out is that every one of the D-held CDs has a lower turnout than any of the R-held CDs. The CD3 and CD7 turnout numbers are among the worst in the nation.
I assume this is due to decades of ruthless voter suppression. Allowing this to persist strikes me as political malpractice on an epic scale.
By construction, all CDs have very nearly the same population, so the voter turnout ideally “should” be the same.
In some narrow district-by-district sense, you can hardly blame Gallego and Grijalva for organizing and campaigining more vigorously in their districts, because their seats are already safe. However, from the broader statewide perspective, it would really pay to do more voter registration, campaigning, and GOTV in these areas.
You can perhaps think of this a “reverse coat-tail” effect, where district-by-district results make an impact on the statewide totals. Alternatively, it might be smart to just ignore the district races and instead think in terms of geographic zones that have been sorely neglected.
Redistricting is likely to change the CD boundaries and/or CD numbering, but the point remains that these geographic zones cry out for attention from the state and national party. This is some very, very low-hanging fruit.
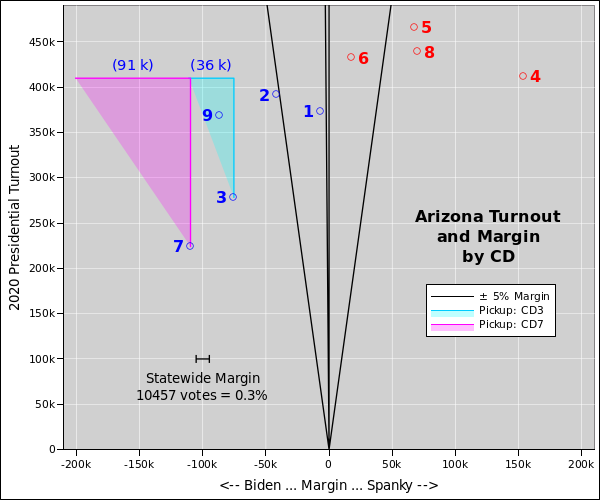
Figure 2 drives home the point. Suppose that we upgrade the turnout in CD7 and CD3. We increase it enough to make those districts comparable to CD4, i.e. the lowest-turnout R-held district. This is shown by the shaded triangles.
The upgrades will increase the number of ballots cast by more that 315,000. That’s a lot.
More to the point, suppose we keep the R/D percentage of the electorate the same. The percentage margin is represented by the slope of the hypotenuse for each triangle. Then upgrading the turnout will change the statewide margin (R−D) by more than 126,000 votes, just for these two CDs. The incremental margins are shown by the horizontal legs of the triangle, and are labeled on the graph (91 k and 36 k).
That is an absolutely enormous change in the margin. Even if the effort is only halfway successful, half of that number is still enough to flip a lot of statewide races. The 2020 presidential race in Arizona was decided by only 10,457 votes (0.3%).