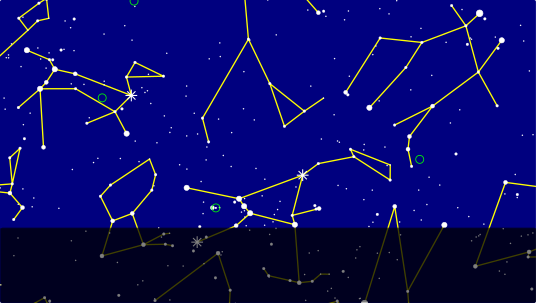
In the real world, people a couple of time-zones east or west of you will find that Orion is completely above or completely below their horizon.
This is a big problem for any flat-earth model, since a star cannot possibly be above the horizontal plane for some observers and not others. That’s because the horizontal direction is the same for everybody. That’s what “flat” means.
All parts of that are nonsense. If you just look at the stars, you see that they do not get appreciably brighter or dimmer as they travel across the sky. Strictly speaking there is “some” optical distortion in the atmosphere, but not enough to be relevant. You can easily check that the constellations maintain their size and shape as when they are rising, when they are setting, and in between.
We routinely see lots of stars close to the horizon. Nothing bad happens to them. If you think stars don’t set below the horizon but instead disappear while they are still well above the horizon, take pictures. Nobody has ever taken pictures of such a disappearance, because that’s not what happens in the real world. Note that taking time-lapse pictures with a smartphone is easy.
Any map needs a scale factor. That’s sometimes expressed in miles per inch, meaning that one inch on the map corresponds to so-and-so many miles in real life.
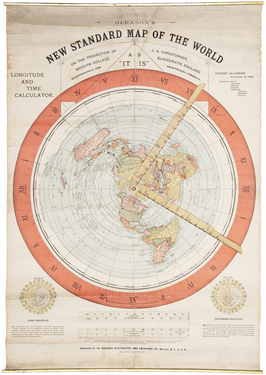
The Gleason map’s projection is called “equidistant”, but that only applies to north/south directions. The scale factor is the same everywhere on the map for north/south distances. In contrast, the east/west scale factor is a mess. Not only is it not conststent with the north/south scale factor; it’s not even consistent with itself. It changes from place to place on the map, drastically, depending on latitude. Having inconsistent scale factors means the map will distort the shape of things, as we now discuss.
Since we don’t know the actual miles-per-inch of this map, we will simply assume that the north/south scale factor is correct, and measure the east/west scale factors relative to that.
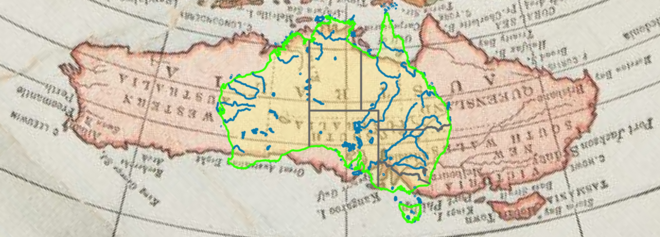
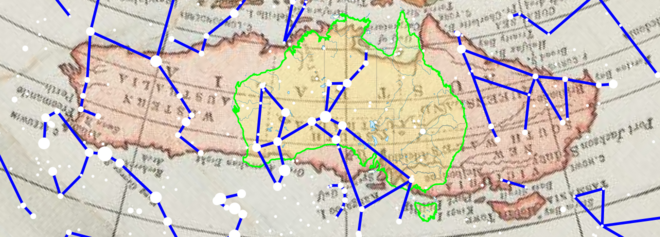
As it turns out, there are actual people living in Australia; 25 million of ’em. They have roads. They have cars. They have odometers and GPSs. They have maps that agree with the actual geometry of the place. They know that going E/W from Brisbane to Perth is only sbout 20% farther than going N/S from Bamaga to Melbourne ... not 3× farther, as Gleason would have you believe.
The size and shape of Australia was well known at the time when Gleason was preparing his map.
It seems self-centered – literally – for a flatnik in Buffalo NY to choose a north polar projection, which works reasonably well at high northern latitudes, but is complete garbage in the southern hemisphere.
This distortion is a consequence of the inconsistency between the north/south scale factor and the east/west scale factor.
So you don’t even need a car or a map. All you need is a phone. Contact a friend 2000 or 3000 km away and ask which stars are overhead. If the stars are where they should be, you know the Gleason map is a crock.
Note: At first glance, theconstellations in the diagram appear backwards relative to their familiar normal appearance. That’s because we are looking down on them from behind. This is a faithful plot of what’s overhead where at 7:00 sidereal time.
There are actual people who live at the south pole, about 50 of them year-round, plus a hundred more during the sunny months.
So the question arises: Where is the south pole on the Gleason map? It must be directly south of Chile, directly south of Australia, and directly south of Africa, as millions of people can verify by going outside and looking at the stars. However, alas, those three requirements are grossly incompatible.
To see what I mean, Go to figure 2 and try to put your finger on a point that is south of Chile, south of Australia, and south of Africa. It can’t be done.
The flatniks argue that since you can’t get to the south pole, it doesn’t matter whether it even exists. To that I reply that first of all, you actually can get to the south pole. It’s not easy, but I personally know two people who have been there. Furthermore, it does matter, because even if you can’t see the south geographic pole with your own eyes, anybody in the southern hemisphere can see the south celestial pole, which lets us infer where the geographic pole must be.
The key point here is that applying an azimuthal equidistant projection to the earth requires the same projection to be applied to the stars, if you want any hope of a consistent model of what’s overhead any given point. Even then, that hope is in vain. If the star map makes sense north of the equator, it cannot possibly make sense south of the equator. It is not consistent with the behavior seen in the video in figure 5. It is even more obviously ridiculous than the terrestrial map, because we have a better view of it.
If flatniks want to be taken even semi-seriously, they need to produce a simple, straightforward, faithful map of the whole earth.
All the sight angles point to something very very far away, as they should.
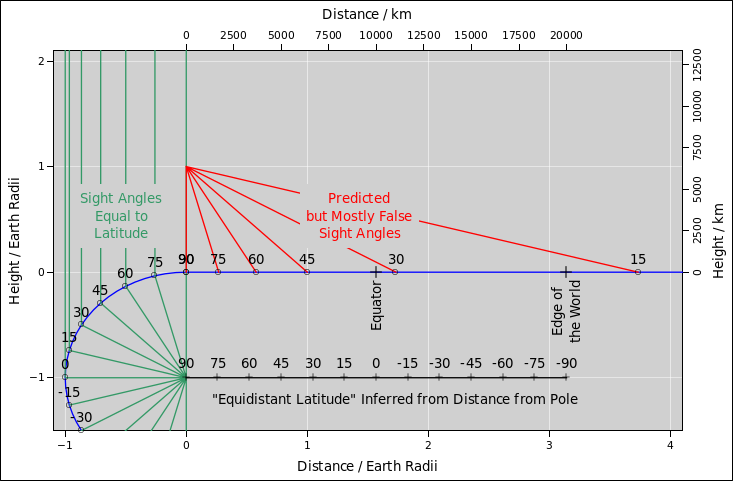
The rest of the diagram shows what the sight angles would be in the imaginary world described by the Gleason map. The only way we can even hope to make sense of the angles is to assume that they point to something rather nearby, only about 6370 km above the geographic north pole. (Not coincidentally that is the radius of the earth, Re. The distance from the pole to the equator is π/2 Re, i.e. 10,000 km.)
This works reasonably well if you stay very near the pole. At latitude 75∘ north, the sight line is approximately 75∘ above the horizon, as it should be. However, things soon go to pot. Except near the north pole, equally spaced angles do not correspond to equally spaced distances along the surface of the alleged flat earth. By the time we get to the equator, the pole is still more than 30∘ above the horizon, even though it should be all the way down on the horizon. Everywhere south of the equator the flat earth model predicts the north celestial pole is above the horizon, which is crazy. Even when we are at the outer edge of the disk, about to fall off the edge of the world, the north pole is still more than 15∘ above the horizon.
The Gleason map is based on a so-called “equidistant” projection, which means its lines of latitude are equally spaced in terms of north/south distance along the ground. The problem is, this notion of latitude cannot be reconciled with the sight angles. Any flat-earth model will have the same type of problem. If the sight angles are right at one point they will be wrong almost everywhere else. The errors are super-easy to notice.
At the simplest qualitative level: In the real world, anyone south of the equator will find that the north celestial pole is not visible, because it is below the northern horizon. The flat-earth model cannot accomodate this fact, because everyone north of the equator says the pole is above the horizon ... and in a flat world, it can’t be above the horizontal plane and below the horizontal plane at the same time.
We now tell a similar story without reference to any map. Pick a star that is high overhead your location. Then phone a friend who is 5000 km from your location in any direction ... or multiple friends who are 5000 km away in multiple directions. In the real world your star will be 45 ∘ above the horizon for them. Similarly, anybody who is 10,000 km from your location will find your star low on their horizon.
In contrast, in any flat-earth model, your star will be above the horizon, i.e. above the horizontal plane, for everybody. That’s because the horizontal direction is the same for everybody. As previously mentioned, that’s what “flat” means.
Figure 6 can be re-used to describe this situation. You don’t need a map; all you need is a phone and an understanding of what “distance” means.
A flat-earth model cannot possibly explain why the direction reverses when you cross the equator.