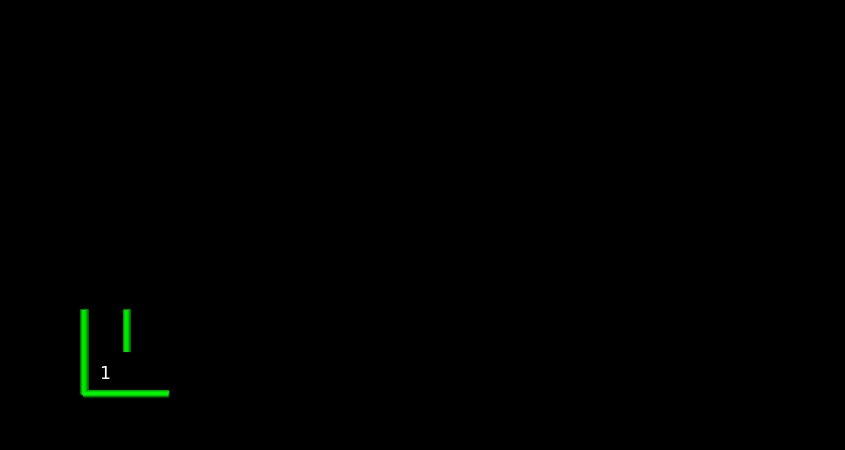
Figure 1: Maze : Initial Condition
One often hears the advice “Never give up!” – which if taken literally is terrible advice. It’s true that sometimes people give up when they shouldn’t, but it’s equally true that sometimes they perseverate when they shouldn’t. In reality, is is routinely necessary to give up on unimportant sub-goals in order to make progress toward the important overall goal.
Familiar examples include:
You’ve got to know when to hold ’em,
know when to fold ’em,
Know when to walk away,
know when to run.
Perhaps I can best describe my experience of doing mathematics in terms of a journey through a dark unexplored mansion. You enter the first room of the mansion and it’s completely dark. You stumble around bumping into the furniture, but gradually you learn where each piece of furniture is. Finally, after six months or so, you find the light switch, you turn it on, and suddenly it’s all illuminated. You can see exactly where you were. Then you move into the next room and spend another six months in the dark. So each of these breakthroughs, while sometimes they’re momentary, sometimes over a period of a day or two, they are the culmination of – and couldn’t exist without – the many months of stumbling around in the dark that proceed them.
Let’s be clear: It is never simply a question of more risk or less risk; it’s a question of taking well-calculated risks, where the average payoff greatly exceeds the average loss. The zero-risk strategy is usually not a good strategy, because it produces zero payoff.
We do not glorify risk for its own sake, and we certainly do not advocate waste. We make investments and run some risks, in the expectation of getting a good payoff on average.
In a maze, as previously mentioned, entering an unknown branch that turns out to be a dead end is not a mistake. It is a cost, not a mistake. It is the cost of acquiring information.
Of course mistakes are possible; for example, it would be a mistake to re-enter a blind alley that you’ve already explored, because that would incur additional cost without providing additional information.
Non-scientists tend to have a grossly oversimplified view of how science is done. In particular, please do not confuse the way research results are published and/or taught with the way research is actually done. The textbooks and the scientific papers generally use 20/20 hindsight to give you an overview of the already-explored maze, including the shortest path to the goal. For various reasons (good and bad), they don’t tell you about all the blind alleys the scientists had to explore before finding the optimal solution.
The so-called “scientific method” is not nearly as methodical as non-scientists imagine it to be. See reference 4.
Please do not tell people to “never give up”. That’s a terrible advice. It doesn’t even address the right question. When exploring a maze, you must give up on a multitude of dead ends, in order to advance the main overall goal. The sooner you give up on each dead end, the better. So it’s never a question of whether to give up; it’s a question of what to give up, and what not.
Instead: If they are giving up too soon, tell them they are giving up too soon on such-and-such idea. Conversely, if they are not giving up soon enough, tell them they are not giving up soon enough on such-and-such idea. Much depends on what the idea is.
It must be emphasized that backing out of a dead end does not mean there was a failure, a wrong turn, a mistake, or a bad decision. In general, information comes at a cost. At some point in the middle of an investigation, a scientist might entertain a huge number of hypotheses, knowing that only a few of them will be consistent with the facts, when more facts are known. The cost of exploring some large number of avenues that don’t work out is part of the cost of finding the one(s) that do.
Exploring blind alleys is never the objective; it is a cost and a risk. Even so, it is necessary, to some extent. We don’t want to accept too much risk – or too little.
When running a maze, a bad strategy can be tremendously wasteful. A good strategy minimizes the cost, even though the cost will be nowhere near zero. Even with the best strategy, there is always a significant amount of backtracking. To observers who do not understand what’s going on, the backtracking looks like waste, but it is not.
The process of exploring a maze is a good metaphor for how research is done. When you start out, the situation is more-or-less as shown in figure 1. You start out in the lower-left corner. You can see at most one or two steps in any direction ... or even less if a wall intervenes. You don’t know the layout of the maze, and you don’t know how big it is. is. You don’t know where the cheese is, or even what it looks like ... and you won’t know until you’ve found it.
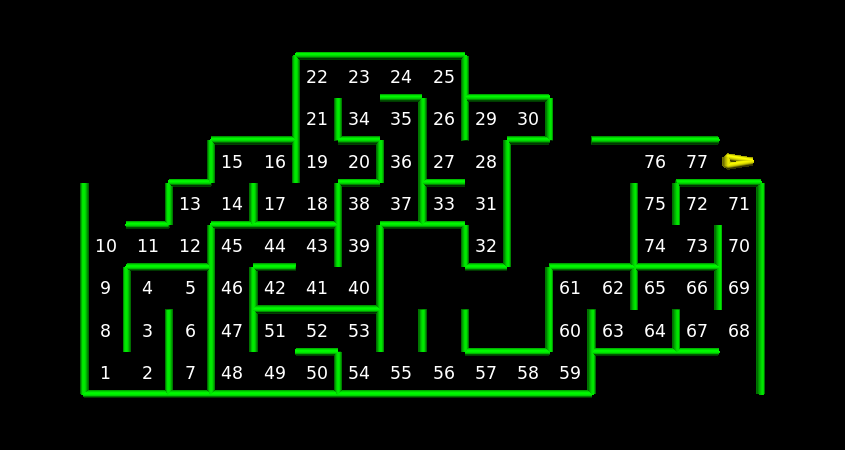
Here are some remarks about what happened when I solved this maze. My path to the solution is shown in figure 2.
For example, at steps 10, 55, 56, 68, and 76 I made the “lucky” choice. This does not mean I was smart. Here’s what it actually means:
These diagrams are screen shots from the interactive maze-exploration program in reference 5. There is one version that runs interactively in your browser, and another version that you can download and run from the command-line as a stand-alone python program.
In school, the students want to learn as efficiently as possible, and the teachers want to teach as efficiently as possible. Everybody wants to get to the goal by the shortest route. This is entirely reasonable. Students do not want to retrace the path that Andrew Wiles took as he was stumbling around in the dark – and they simply could not afford to, even if they wanted to. It’s too painful and time-consuming. Folks want to know in advance how big the final reward to be, and they want to know how long it will take to get there. They want a brightly-lit maze, and a map showing the shortest route.
Finding the shortest path to the cheese requires extra work – even after “some” path has been found. Note the contrast:
| For a small two-dimensional maze, if you can get a clear top-down view you can spot the shortest path rather easily. | When dealing with a large maze in a high-dimensional space, there is an exponentially large number of possible paths, and it is not the least bit obvious which one is the shortest. Even if you have found 992 paths that are all nearly the same length, it may be that the 993rd path is much shorter |
Now we come to the main point of this section: The ordinary classroom experience is not remotely similar to how research is done.
| In the classroom, in the interest of clarity and efficiency, there is very little backtracking. | In the research lab, there is a tremendous amount of backtracking. |
Bad theories are cheap. Idle speculation, unconstrained by reality, is the easiest thing in the world.
To construct a good theory is much more of a challenge. For one thing, you need a tremendous amount of data, which is expensive unto itself. Then you need to do a lot of work to come up with a theory that actually fits the data and makes useful predictions.
Data guides theorizing, but the reverse is also true: Theory guides data-taking, as we now discuss.
In figure 2, consider the situation after step 33. Some backtracking is required. I suggest that it would be a bad decision to re-start by proceeding north from from step 10. That’s because experiments are always guided by theory. In this case, let’s assume we know (perhaps from experience and/or from reading the code) that in this game, the cheese is always somewhere near the northeast corner. Similarly, assume we know that the maze size is 16×8. After step 33 (indeed after step 22) we already have enough information to know that there is no “northwest passage”. In this case, theory assigns zero probability of success to the scenario that proceeds north from step 10. Proceeding south from step 23 is a much better bet.
A very similar situation occurs at step 68. We have two choices, but one of them has zero probability of success.
A less-extreme example of the same idea can be seen at step 76. There are two possibilities: we could proceed west or east. I suggest that west is not the best choice. That’s because you can infer, based on what you see and what you don’t see that any path from west of 76 to the northeast corner must be long and convoluted, if it exists at all. The path from east of 76 will be shorter, if it exists, and it is more likely to exist, because there are fewer things that could go wrong.
Somewhat more generally, there could be N possibilities, all of which have some nonzero probability, in light of the presently-available theoretical and experimental information. In such a situation, you take the probabilities into account when making your choice. Even more generally, you need to take into account:
Furthermore, if the costs come early and the payoff comes late, you need to calculate the net present value, which takes into account all of the above plus the time-value of money, including interest rates and inflation rates.
In elementary school, you may have learned the following theory about how to explore a maze:
Follow along the wall, always keeping your right hand on the wall.
Obviously you can do the same thing keeping your left hand on the wall. Either way, this is called Harvey’s algorithm, named after Harvey Wallbanger.
Harvey’s algorithm is guaranteed to work for some types of mazes, but not for all.
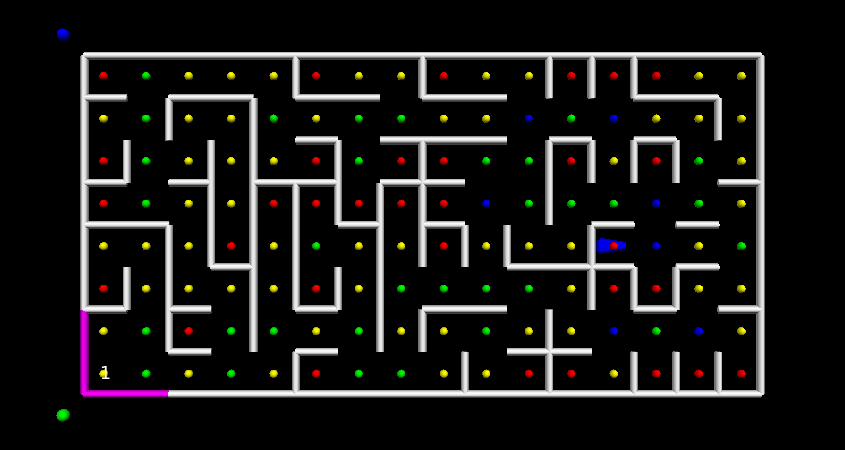
To say the same thing the other way, Harvey’s algorithm might fail if the cheese is somewhere in the interior of the maze, and if the maze contains loops. Every looping path creates an island. An example is shown in figure 3.
| When it works, Harvey’s wall-banger algorithm has the virtue of simplicity: You don’t need to make any nontrivial decisions, and you don’t need to remember anything. | It’s ironic, but when the maze has loops, there are more possible paths to reach the cheese ... but you are less able to find a successful path using Harvey’s algorithm. |
In real-world research, Harvey’s algorithm virtually never works. You have to make huge numbers of nontrivial decisions about what to explore. You have to keep records, to keep track of what avenues have been explored and what have not, so as to avoid wasteful duplication of effort.
A central axiom of decision analysis says that the outcome does not entirely determine the merit of the decision. That is to say, sometimes a good decision pays off, but even when it doesn’t, it was still a good decision. (Conversely, sometimes a bad decision pays off, but even so, it was still a bad decision.) In any case, there definitely is such a thing as a bad decision. Here are contrasting examples:
| Good Decision | Bad Decision |
| Suppose you come to a point where there are several ways to proceed. Theory indicates that several of them are viable, plausible possibilities. You pick one of them and explore it. It turns out to be a dead end. The decision to explore this avenue was a good decision. It was not wasteful. The outcome was not the most valuable possible outcome, but still it had some value, becaue you obtained information. That is, you learned that the cheese is not to be found in this branch of the maze. This information is valuable. The price of information is a necessary part of the cost of doing business. | Suppose you explore an avenue that has already been well explored. This is a bad decision. It is wasteful. The information that it gives you could more easily be obtained by looking at the records of previous exploration. This sort of thing can definitely happen in real life, which is why researchers need to search the literature before doing an experiment (unless the experiment is super-cheap). |
| Sometimes there is value in revisiting some branch of the maze, to check for mistakes. However, if the branch has already been checked and rechecked, the value of additional checking goes down exponentially. |
| Exploring a plausible scenario is often a good decision, because provides valuable information, even if it doesn’t immediately find the cheese. It increases your odds of finding the cheese in a later step. | Needless duplication of effort is a bad decision ... and also a bad outcome. |
| It is wise, and indeed necessary, to take some well-calculated risks. | It is unwise to take uncalculated or poorly-calculated risks. |
| Deciding not to play the lottery is a good decision, because the expected value is small compared to the cost. | If you decide to play the lottery, if you win it is a good outcome – but it was still a bad decision. |
You should not imagine that every decision has only two possibilities. Sometimes there are three or more scenarios that must be considered. In the language of mathematical graph theory, the degree of connectivity of a node is the number of links that connect to that node.
In figure 3, the dot in each cell is color-coded according to the degree of connectivity. Here’s the legend:
| Color | : | Degree | : | Name | Remarks |
| Red | : | 1 | : | Dead end. | |
| Yellow | : | 2 | : | Passage. | One way out (other than the way in). |
| Green | : | 3 | : | Tee. | Two ways out (other than the way in). |
| Blue | : | 4 | : | Crossroads. | Three ways out (other than the way in). |
Here’s the histogram, showing the number of cells with a given connectivity, for the maze in figure 3.
| Degree | # of Cells | |
| 0 | 0 | |
| 1 | 32 | |
| 2 | 57 | |
| 3 | 32 | |
| 4 | 7 |
There is a vast literature devoted to this general topic. Sometimes it is called
Version 1 of the program runs interactively in your browser:
./glorpy-maze.html
Version 2 is a stand-alone python program that you can download and run
from the command line.)
./maze-local-info.py