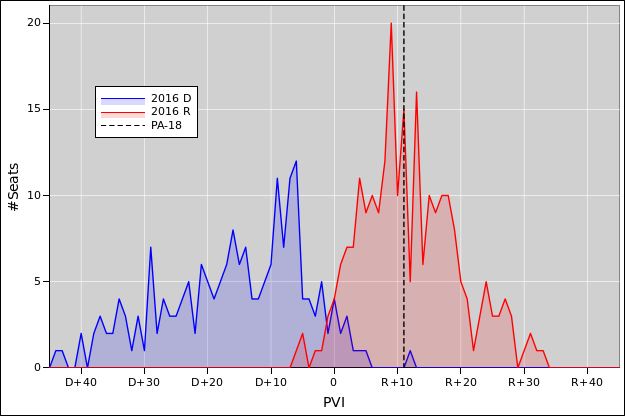
Figure 1: PVI Histogram, Showing Gerrymandering
In simplest terms: Under “normal” conditions, in a district with a PVI of R+5, you would expect the R candidate to win by a 10-point margin, on average. (That is, the R candidate gets 5% more than break-even, while the D candidate gets 5% less.) The data is consistent with this, insofar as districts with a R-leaning PVI are mostly held by Rs.
HOWEVER, these are not normal times. In recent special elections, the margins have been shifted in the D direction by huge amounts.
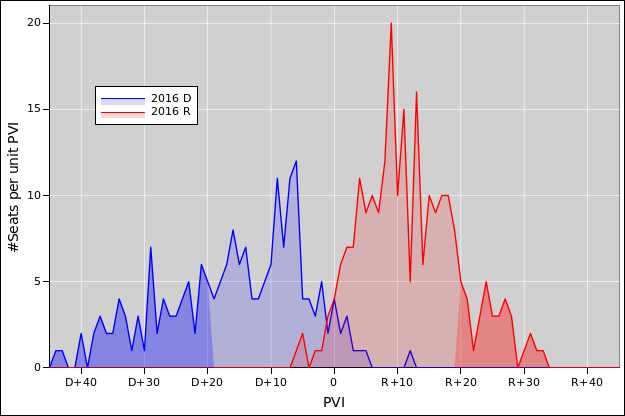
Figure 1 shows a histogram of the Cook Partisan Voter Index (PVI) data. The blue curve shows the number of Democratic house seats at any given PVI, while the red curve shows the same for Republican house seats. In each case, the area under the curve is the total number of seats held by that party.
The first thing to notice is that the red curve is much more compact. The two curves are not mirror images of each other. For each curve, the region with more than 20 points of partisan lean are more heavily shaded. You can see that the D+20 part of the blue curve has almost twice the area of the R+20 part of the red curve. This is the result of gerrymandering. It is a scheme to cause Democrats to be underrepresented and Republicans to be overrepresented in the congress.
Looking at the middle of the diagram, we see that there are remarkably few swing districts. Some of this is due to gerrymanding, but some of it is due to self-sorting. That is, people choose to live near people who have similar views. So even impartially-drawn districts would not be very swingy.
Never confuse the absence of one thing with the presence of another. The following distinction must be emphasized:
Another thing to notice is that the curves do not overlap very much. That means the PVI is reasonably (albeit not perfectly) consistent with the outcome of the 2016 elections. (If it were perfectly consistent, the curves would not overlap at all.)
We can interpret this as follows: In 2016, the forces of partisanship and tribalism were very strong. The qualifications and the policies of individual candiates were relevant only at the margins.
HOWEVER, the 2017 and 2018 special elections are another story. Democratic candidates have been significantly overperforming. Some of this may be due to candidate quality, but policies and issues are having a large systematic effect.
Resistance is not futile.
Figure 2 highlights the results of the special election in the Pennsylvania 18th (13 March 2018). The district is rated R+11, but the result was a nail-biter.
So let’s extrapolate. If R+11 districts are borderline, then you might imagine Dems could win in an R+10 district by a decent margin. There are 114 seats currently in GOP hands that are rated R+10 or bluer. If Dems pick up those seats, it will be a blowout of historic proportions. For November, we should allow a few points for the advantage of incumbency, which is obviously not a factor in special elections, but even so, there are 62 seats rated R+6 or bluer. They only need to flip 24 to retake the majority, giving them near-unlimited power to investigate things.
If you look at it district-by-district, some of the biggest creeps look vulnerable. Reference 1 tabulates the data, sorted in a useful way.
Again: Resistance is not futile!
For additional “data journalism” on this topic, see reference 2.
Thanks to Cook Report for making the raw data available in a form suitable for further analysis.