Real Scientific Methods
John Denker
1 Overview
When sensible people speak of «the scientific method», what
they really mean is something quite grand,
covering a range of ideas including:
- How science is done.
- The underlying principles of science.
- The nature of science.
- The character of physical law.8
- ... or something like that.
Section 2 takes up the discussion of how science is really
done.
Let’s take a brief digression to talk about the terminology: Voltaire
famously remarked that the Holy Roman Empire was neither holy, nor
Roman, nor an empire. It’s an idiomatic expression. In English,
there are hundreds of such expressions, as discussed in
reference 1. An idiomatic expression must never be
taken literally; otherwise, it crosses the boundary from idiomatic to
idiotic.
It is important to realize that «the scientific method» is an
idiomatic expression, and can be quite misleading. For starters, it
ought to be plural not singular, because there is not any single
method for doing science, just as there is not any cut-and-dried
method for writing a novel. In fact, scientists use a great many
methods. This point is discussed in reference 2 and
elsewhere. Alas, misconceptions about this are appallingly common
among non-scientists.
Furthermore, many of the “methods” used in science – and in
research in particular – are not nearly as methodical as
non-scientists seem to think. In fact, although some scientific
activities are highly methodical, many others are not. One is
reminded of Pólya’s dictum: Try something; if that doesn’t work, try
something else. Exploration, heuristics, and serendipity have always
been an imporant part of science, and always will be.
It is easy to get deceived about this. Part of the problem is that
when a scientific result is explained in a publication, the
explanation is expected to be systematic and methodical – even if
most of the work that went into obtaining the result was not. As
discussed in section 3.9, it is an infamously
common mistake to confuse the way scientific results are initially
obtained with the way they are finally explained.
People who have not done any research, nor even seen it done,
sometimes equate «the scientific method» with a step-by-step
hypothesis-testing approach, perhaps along the lines spelled out on
the poster discussed in section 4. This is a travesty. It
makes research seem hundreds of times easier than it really is.
Therefore it is an insult to every researcher – past, present, and
future. Similarly, it is a disservice to students who may be thinking
of becoming scientists, since it gives them a false impression of what
they are getting into. In addition, overemphasis on one particular
method makes it impossible to understand the history of science.
Some of these misconceptions are discussed in more detail in
section 3 and section 4.
* Contents
2 Some Remarks on How Science Is Done
Here are some of the principles that guide how science is done:
- 1.
As discussed in section 1
and item 9, “the scientific
method” is an idiomatic expression, and must never be
taken literally. Science uses many methods. There will
never be a pat answer to the question “what is science”. The very
notion that there could be a pat answer bespeaks an attachment to
rote learning that is incompatible with scientific thinking.
- 2.
The major goals of science include making useful
predictions, avoiding mistakes, and allocating scientific resources
wisely.
- 3.
Very often, scientific predictions are not exact. A
prediction does not need to be exact to be useful. Laws, theories,
and models have limitations. You should neither over-react nor
under-react to these limitations. See item 11 and
section 3.4 for more on this.
-
Sometimes it is possible to make useful predictions, and
sometimes not. If you are asked to predict the exact total shown on a
particular roll of a pair of fair dice, you will be wrong at least
5/6ths of the time. That’s not very useful ... unless you can get
into a situation where the payoff is greater than 6-to-1, in which
case you can make money on average, even though you are “wrong” most
of the time. This example illustrates the idea that usefulness
depends partly on how often you are right, but also on how big the
payoff is.
Note that even when a useful prediction is possible, you still need to
do some work to distinguish good predictions from bad predictions.
For example, if the payoff is 8-to-1 you will on average make money if
you make the optimal prediction (7 pips) every time, but you will lose
money if you make a dumb prediction (such as snake-eyes) every time.
- Indeed finding new methods of approximation is an
important scientific activity. A practical approximate method is
far more valuable than an impractical exact method.
- Given a set of imperfect rules, you should not imagine that they
are equally imperfect. In science, as in everyday life, you must
exercise judgment and skill, in order to decide what’s a good
approximation and what’s a bad approximation in any given situation.
This may require making sophisticated multi-dimensional tradeoffs.
See section 3.6 and section 6.1 for more on this.
- 4.
It is often unnecessary and impractical to measure
and/or calculate things exactly. Instead, in some cases it suffices
to show that the result is qualitatively within tolerances. In
other cases it may be appropriate to quantify the uncertainty of
the distribution over results. Procedures for doing this are
discussed in reference 3. This point is related to
item 3 and item 11.
- 5.
The idea of hypothesis testing is not nearly as
important as non-experts seem to think. It is at best one tool in a
very large toolbox. When doing experiments, it is common to begin
with one set of hypotheses, and then end up with a completely
different set. This is another manifestation of the difference
between obtaining and explaining a result: A result that is explained
in terms of hypotheses often was not obtained that way. It is
actually quite common to begin experiments with no clear hypotheses at
all, especially when exploring new territory. See section 3.7 and reference 4 for more on this.
- 6.
Terminology is not nearly as important as non-experts
seem to think. Ideas are primary and fundamental; terminology is
tertiary. Terminology is important only insofar as it helps us
formulate and communicate the ideas.
In particular, here is a list of terms that could be used to describe
scientific results. Scientists and other thoughtful experts use
these words almost interchangeably, without bothering to assign
narrow definitions. (Sometimes there are slight variations in
connotation, but the signal-to-noise ratio is very poor.) Therefore
it is a colossal waste of time when non-experts pretend to assign
precise meanings to these terms.
Famous examples include:
- Gauss’s law.
- Newton’s theory of universal gravitation.
- Newton’s method.
- Cramer’s rule.
- Euler’s identity.
- Parseval’s theorem.
- Maxwell’s equations.
- Pascal’s principle.
- The parallel postulate.
- The Peano axioms.
- The Fourier transform.
- The Lorentz transformation.
- The Euclidean algorithm.
- The Tolman relation.
- The Kutta condition.
- The Cauchy criterion.
- The quadratic formula.
- The big-bang model.
Most of these examples could be reworded with no change in meaning:
Maxwell’s laws, Newton’s algorithm, Parseval’s identity, et cetera.
Sometimes a change in wording would change the meaning of a phrase
... but still, neither meaning is systematic. For example, the
Maxwell relations are distinct from the Maxwell equations. However,
this is due to historical accident and idiomatic interpretation, not
to any systematic difference in meaning of the individual words. The
same can be said of the the distinction between Laplace’s
law
and the Laplace
equation.
|
As mentioned in item 11 and section 3.4, any
scientific law, theory, principle, etc. comes with provisos and with
limits to its validity. It may take several sentences, several
paragraphs, or several pages to explain these provisos and limits.
This commonly requires conveying thousands upon thousands of bits of
information.
|
|
Changing a single word – such as renaming a “law”
to a “theory” or vice versa – conveys only a few bits of
information. This is nowhere near being sufficient to describe our
degree of confidence in the idea, let alone describe the provisos or
the limits of validity.
|
We therefore conclude that the idea of a “law” gradually developing
into a “theory” is provably absurd. Trying to judge the validity or
importance of an idea based on whether it is called a “law” or a
“theory” must be considered an extreme form of judging a book by its
cover. As such, it is the opposite of science and the enemy of
critical thinking.
- 7.
The word “theory” can be used in two radically
different ways.
|
One usage refers to a coherent system of evidence,
principles, and methods, offering a comprehensive understanding of a
broad topic. (This is much grander than any single rule or fact.)
|
|
The
other usage refers to a hypothesis, conjecture, or mere speculation.
|
This ambiguity can cause all sorts of problems if you’re not
careful. See section 3.11 for the details on this.
- 8.
The word model is also used with a tremendously
wide range of meanings. For example, in the world of toys, a model
train may represent rather faithfully the external appearance of a
real diesel locomotive, and may model some of its behaviors. However,
it does not model the inner workings, in the sense that it is not
really powered by diesel fuel. At one extreme, a teddy bear is not a
faithful model of the appearance or behavior of a real bear, so its
connection to the real world depends on a great deal of abstraction,
symbolism, and imagination. At the opposite extreme, the Maxwell
equations (if propertly interpreted) provide a wonderfully faithful
model of the real electromagnetic field. On the third hand, even the
Maxwell equations are often misinterpreted.
In many cases a model can be called a theory, and a theory can be
called a model. The two words do not mean exactly the same thing,
but since both definitions are so broad and fuzzy, it is not worth
fussing over the details.
- 9.
You also have to be careful about how the word “method”
is used. The word by itself is not misleading or even ambiguous, but
the phrase «The Scientific Method» is an idiomatic expression, and
would be grossly misleading if taken literally, as mentioned in
section 1 and item 1.
-
The plain meaning of “method” refers to a technique or
tactic, such as the method of images, the method of steepest descent,
the Newton-Raphson method, et cetera.
- The idiomatic expression «the scientific method» refers to
something else entirely, namely an overall approach,
an overarching principle, or a grand strategy for doing science.
It addresses the fundamental question of “what is science”.
This idiomatic expression strikes me as unnecessary and abusive. If
you want to talk about strategy, call it “strategy” (not «the
scientific method»). If you want to talk about the nature of
science, call it “the nature of science” (not «the scientific
method»). For example, the NSTA has a nice discussion of the nature
of science (reference 5).
- 10.
Mathematical results are validated by formality and rigor.
This gives us logical statements of the form “If A then B” et
cetera. Meanwhile, physical-science results are sometimes validated
by logic, but may also be validated by appeal to experiment. The
latter gives us statements of the form “We observe A” et cetera.
Generally science is a complex lattice of facts and rules, combining
observations and logic.
- 11.
Scientific rules generally have a limited domain of
applicability. To state just the headline of a rule – without
stating the limits of validity – is improper, and can lead
to horrible mistakes. For more on this, see
section 3.4.
- 12.
From time to time, an established rule may be refined.
It may be supplemented by other rules so as to extend the domain of
validity. It may be supplemented by exceptions to improve the
accuracy. However a rule with too many caveats and exceptions is
likely to be inconvenient as well as unreliable. Occam’s razor and
all that.
- 13.
From time to time, a rule may be supplanted entirely by
a simpler and better rule. See reference 6 for a famous study
of how new theories compete with old ones.
- 14.
If a rule stands in need of improvement, you should
offer specific and constructive criticism. See
section 3.5. In science, as elsewhere, non-specific
and/or non-constructive criticism doesn’t do anybody any good. And
it’s bad manners.
- 15.
Consider all the available data. When evaluating a
set of hypotheses, do not “select” just the data the happens to
support your pet theory. By the same token, consider all the
plausible explanations, not just the first one that comes along that
seems to more-or-less fit the data. For more on this, see section 3.7, section 3.8, and section 10.3.
|
Consider all the plausible hypotheses.
|
|
|
|
- 16.
Always pay close attention to contradictions
between things that you “know”. Contradictions, antinomies, and
paradoxes are powerful indications that your knowledge needs to be
refined, and – even better – they tell you approximately where to
start looking for improvements.
- 17.
An important part of scientific thinking is being
able to recognize non-scientific and unscientific thinking,
as discussed in section 3.
- 18.
Creating new rules from scratch is exceedingly
difficult. There is an infinite number of possible rules, and you
will never have enough data to decide which of the contenders is best
– unless there is some sort of additional guidance. Sometimes
guidance is taken from intuition and from notions of “simplicity” or
“elegance”. This is bordering on metaphysics, but it is an
important part of science.
- 19.
Scientists, like business executives, government
leaders, and everyone else, must often make decisions based on highly
incomplete data. Therefore it is important to be able to change your
mind as soon as you get new data that contradicts old hunches. This
requires keeping score on each of the rules, keeping track of which
are well-supported by existing data, and which are less-well-supported
and therefore more open to revision. It is impossible to do anything
without make “some” assumptions, but this should be kept to a
minimum. Instead, make a list of things that could happen. Be
prepared to question old assumptions whenever new data comes along, as
discussed in section 6.3.
- 20.
The process of designing an experiment is important
and challenging. You have to design the experiment before you can
carry it out. This process is important for scientists, engineers,
farmers, and others. Roughly speaking, the objective is to find a way
to obtain the information you need, without undue cost. See section 10.1 for more on this.
- 21.
Another important scientific activity is just
plain looking at the data. Much effort and ingenuity goes into
finding ways of organizing and displaying the data, in hopes of
discovering trends or patterns. The fancy term for this is
visualization. An graph of Y versus X is sometimes helpful
but sometimes not sufficient. Similarly, a table showing the X and
Y numbers is sometimes helpful but sometimes not sufficient, because
it is hard to visualize the meaning of raw numbers. Often a graph and
a table is better than either one separately. Sometimes you need a
fancy program to run queries against the data (e.g. google). As the
facetious saying goes, “When all else fails, look at the data”.
- 22.
Another method of great importance to scientists is
calculation. This is so obvious that it often goes without
saying, but it would be tragic to overlook it. Quite a few books
have been written on the subject of “Mathematical Methods of Physics”
(Courant & Hilbert; Morse & Feschbach; Matthews & Walker; Boas;
Arfken & Weber; and many others).
Every increase in computer power increases the importance of
calculation, computation, and numerical modeling.
Often calculation and computation go hand-in-hand with visualization
(item 21).
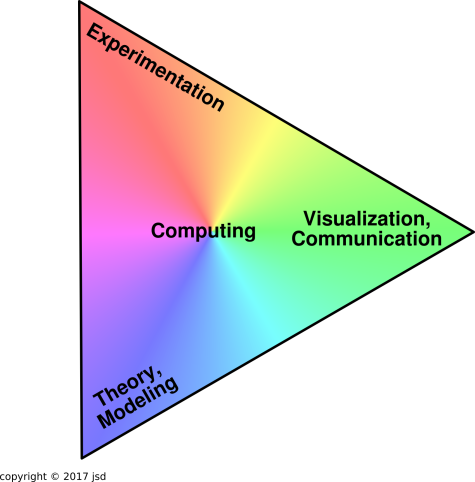
- 23.
Perhaps the most important thing is to combine
ingredients, as outlined in figure 1.
Galileo is called the father of modern science because he made a
point of checking theory against experiment and vice versa. Nowadays
visualization and communication are important also; there’s no good
in having data or having an equation if you can’t understand what
it’s telling you.
Nowadays computers are heavily used to help run the experiments,
help solve the equations, and help visualize everything.
For additional discussion of “thinking skills” per se – including
how to learn, and how to teach thinking skills – see
reference 7.
See also reference 8, reference 9, reference 6,
and reference 10 for sensible discussions of what science is, and
how scientists do science.
3 Scientific versus Unscientific Thought Patterns
It is important to know the difference between science and pseudo-science.
Good discussions of this topic include reference 11 and
reference 12.
3.1 Limitations of the Scientific Method
Let’s take a moment to apply the scientific method to itself. That
is, let’s objectively consider the question of whether the scientific
method actually works.
Alas, according to all available data, it does not always work very
well. According to some measures, more people in the US believe in
astrology than believe in evolution, as discussed in reference 13. Scientific evidence works reasonably well for convincing
scientists, but for the other 99.999% of the population, not so much.
Depending on how it is presented, additional evidence might make
people less inclined to believe the right answer, as discussed
in reference 14.
To be effective in the real world, a scientist needs two skill sets:
one for obtaining the results, and another for persuading
non-scientists to believe the results.
3.2 Deception is More Dangerous than Absurdity
There is an important distinction between deceptive and absurd.
An idea that makes wrong predictions every time is absurd, and is not
dangerous, because nobody will pay any attention to it. The most
dangerous ideas are the ones that are often correct or nearly
correct, but then betray you at some critical moment.
Pernicious fallacies are pernicious precisely because they are
not absurd. They work OK some of the time, especially in simple
“textbook” situations … but alas they do not work reliably.
You need not worry about the “most erroneous” errors. You should
worry about the most deceptive and most destructive errors.
3.3 Examples of Unscientific Thinking
You should avoid using fallacious arguments, and you should
object loudly if somebody tries to use them on you. Common
examples of unscientific thinking include:
-
Elementary logic errors, such as circular reasoning,
non sequitur, and many others.
- The fallacy of OTBE (i.e. Other Things Being Equal). Any
expression – or any thought – that depends on OTBE is risky, because
often you don’t know which other things are being held equal.
For details on this, see reference 15.
- Improperly weighted voting. (A thousand pieces of weak
evidence should not outweigh one piece of strong evidence,
as discussed in reference 16.)
- Selecting the data. (It is not right to select
tendentious anecdotes from a mass of data. See section 10.3.)
- Other misuses of probability.
- Argument from no evidence, as discussed in reference 17.
- Proof by bold assertion. (It’s OK to assert something,
so long as you don’t pretend to have proved anything thereby.)
- Dropping or mistaking the provisos and limitations of a rule,
as discussed in section 3.4.
- Appeal to authority, as discussed in reference 16.
- Ad hominem arguments.
- Et cetera.
3.4 The Provisos are Part of the Rule
As mentioned in item 3 and item 11, most rules have
limitations on the accuracy and/or their range of validity. You
should neither over-react nor under-react to these limitations.
Consider the contrast: Equation 1 is very different from
equation 2:
|
x = y provided a, b, and c
(1) |
|
x = y
(2) |
which means x = y in all generality.
It is a common mistake to mislearn, misremember, or misunderstand the
provisos, and thereby to overestimate the range of validity of such a
rule.
There are several ways such mistakes can come about. I’ve seen cases
where the textbook soft-pedals the provisos “in the interest of
simplicity” (at the expense of correctness). I’ve seen even more
cases where the text and the teacher emphasize the restrictions in
equation 1, yet some students gloss over the provisos and
therefore learn the wrong thing, namely equation 2.
Another possibility is that we don’t fully know the provisos. A good
example concerns the Wiedemann-Franz law. There are good theoretical
reasons to expect it to be true, and experiments have shown it to be
reliably true over a very wide range of conditions. That was the
whole story until the discovery of superconductivity. The
Wiedemann-Franz law does not apply to superconductors, and you will
get spectacularly wrong predictions if you try to apply it to
superconductors. My point is that before the discovery of
superconductivity – which was a complete surprise – there was no way
anyone could have had the slightest idea that there was any such
limitation to the Wiedemann-Franz law.
3.5 Constructive Criticism
As mentioned in item 14, offering non-specific and/or
non-constructive criticism doesn’t help anybody.
It is important to keep track of the limitations of each model, and to
communicate the limitations. If you see some folks at risk of error
because they are disregarding the limitations, it is helpful to remind
them of the limitations. Sometimes it is worth trying to find
improved ways of expressing the limitations.
If a model stands in need of improvement, the best thing you can do is
to improve it. Devise a rule that has more accuracy and fewer
limitations. (You may find this is more easily said than done.)
Communicate the new rule to the community, and explain why it is
better.
If you can’t devise a better rule on your own, you might hire a
scientist to do it for you. (Again, you might find that devising
accurate, robust models is more easily said than done.)
There’s a rule that says “don’t borrow trouble”. Conversely, you
shouldn’t spread trouble around, either. Let me explain:
Suppose a rule is good enough to solve Joe’s problem, but is
too limited to solve Moe’s problems. Then it’s not constructive for
Moe to complain about what Joe is doing. It’s none of Moe’s business.
If Moe accuses Joe of using a “wrong” rule, the accusation is false;
the rule is good for Joe’s purposes, and Moe should
not project his problems onto Joe.
Conversely, if Joe notices that the rule is
too limited to handle Moe’s problem, that is no reason for Joe to
distrust the rule within its proper limitations.
This is worth mentioning, because some people want
“the truth” and think “the truth” must be exact and
unlimited. Conversely they think anything that has limitations must
be worthless. (This is an extreme form of over-reacting to the
limitations of a model.) It is a very serious, very common problem.
See section 3.6 for more on this.
If Joe and Moe choose to work together to devise a new, grander model
that has fewer limitations, so that it can handle both their problems,
that is great – but it is their choice, not their obligation, and
should not be an impediment to using the old model to solve Joe’s
problems.
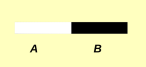
3.6 Beyond Black and White
Sometimes we are faced with black-and-white choices,
as indicated in figure 2.
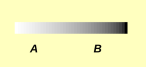
More often, though, the choices form a one-dimensional continuum: not
just black and white, but all shades of gray in between, as indicated
in figure 3.
It is an all-too-common mistake to see things in black-and-white when
really there is a continuum. This well-known fallacy has been called
by many names, including false dichotomy, black-and-white fallacy,
four-legs-good two-legs-bad, Manichaean fallacy, et cetera.
To say the same thing again, it is all too common for people to assume
that everything that is not black is completely white, everything that
is not white is completely black, everything that is not perfect is
worthless, everything that is not completely true is completely false,
their friends are always good and their enemies are always evil, et
cetera.
A related but more-subtle fallacy is to assume that all things that
are not perfect are equally imperfect. In contrast, the fact is
that point B in figure 3 is much blacker than point A,
even though neither one is perfectly black nor perfectly white.
Understanding this is a crucial part of scientific thinking, because
as mentioned in item 3, scientists are continually dealing
with rules that are inexact or otherwise imperfect. The point is that
we must make judgments about which rules are better or worse for
this-or-that application. We cannot just say they are all imperfect
and leave it at that. They are definitely not equally imperfect.
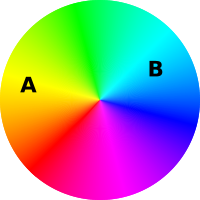
Actually, sophisticated thinking requires even more than shades of
gray. Often things must be evaluated in multiple dimensions,
evaluated according to multiple criteria at once, as indicated
in figure 4. Option A is better for some purposes, and
option B is better for other purposes.
See reference 13 for more about the distinction between
truth and knowledge.
3.7 Hypothesis Testing, or Not
As discussed in reference 4, there are two kinds of
statements: assertions and hypotheses. Unlike an ordinary assertion,
a hypothesis is stated without regard to whether it is true. It might
be known true, known false, probable, improbable, or whatever.
A hypothesis is not a prediction or even a guess. If I toss a coin,
there are two hypotheses as to the outcome: it might come up heads,
and it might come up tails. I do not need to make a prediction before
doing the experiment.
Any experiment worthy of the name involves at least two possible
outcomes. If the outcome of an activity is completely predictable,
there is only one hypothesis that needs to be considered ... but then
the activity is not an experiment. It might be a demonstration or an
exercise, but it’s not an experiment.
I don’t want to argue about the meaning of words. If in your mind the
word “hypothesis” means a prediction or a guess, then we need to
find another word that is free of any such meaning. Sometimes it
helps to talk about “scenarios” or “outcomes”. Perhaps the best
terminology is “things that could happen”; everybody understands
that, even at the grade-school level.
No matter what word you use, the point is that science is not a
guessing game. As mentioned in item 15, section 3.8, and section 10.3, the bedrock principle is:
Consider all the plausible hypotheses.
Consider all the plausible scenarios.
Consider all the plausible outcomes.
Consider all the plausible things that could happen.
|
|
|
|
This is required for safety if nothing else. This is the rule in
daily life, in science, in farming, in small business, in big
business, and even in the Boy Scouts.
It is common for professional scientists to hold a planning meeting,
to come up with a list of things that could happen. Everybody
contributes to the list:
- Alice, what is something that could happen?
- Bob, what is something else that could happen?
- Carol, what is something else that could happen?
- et cetera.
The same team-based approach works well in a classroom situation.
In any case, you need a list. To say the same thing the other way:
Focusing on a single hypothesis, to the neglect of other plausible
hypotheses, would be unsafe as well as illogical.
Again: a hypothesis is not a prediction or even a guess; it is just
something to be considered. One of the principal results of a
scientific inquiry is the ability to make useful predictions – but
this is a result, not a prerequisite. It is the ending point, not the
starting point.
|
After doing the experiment for the first time, you
should be able to make predictions about what will happen in
subsequent experiments of the same type.
|
|
Before doing the first
experiment, there is no way to predict the outcome with any certainty.
The best you can do is to consider all the plausible things that
could happen.
|
More generally, there is no point in doing experiments where the
outcome is known in advance. The point of doing experiments is to
learn something we didn’t already know. The experiment must have at
least two possible things that could happen, or it isn’t an
experiment at all.
In many cases, after a scientific investigation is complete or
nearly complete, it can be summarized in terms of hypothesis testing.
That is, using 20/20 hindsight we can make a list of hypotheses and
say which are consistent with the results and which are ruled out by
the results. One should not imagine, however, that all scientific
work is motivated by hypotheses or organized in advance in terms of
hypotheses. Some is, and but a great deal isn’t.
Science – especially exploration and research – usually involves a
multi-stage iterative process, where the results of early stages are
used to guide the later stages. The early stages are not well
described in terms of hypothesis testing, unless we abuse the
terminology by including ultra-vague hypotheses such as “I
hypothesize that if we explore the jungle we might find something
interesting”.
Typical example: When Bardeen, Brattain, and Shockley did their
famous work, they started from the vague conjecture that a
semiconductor amplifier device could be built. This turned out to be
true, but it was neither novel nor specific. The general idea had
been patented decades earlier by Lilienfield. Indeed a glance at the
following table would have led almost anyone to a vague hypothesis
about semiconductor triodes:
| vacuum-tube diode (known) | | vacuum-tube triode (known) |
| semiconductor diode (known) | | ???
|
The problem was, all non-vague early hypotheses about this topic
turned out to be false. It is easy to speculate about semiconductor
amplifiers, but hard to make one that actually works. The devil is in
the details. Bardeen, Brattain, and Shockley had to do a tremendous
amount of work. Experiments led to new theories, which led to new
experiments ... and so on, iteratively. Many iterations were required
before they figured out the details and built a transistor that worked.
Example: When Kamerlingh Onnes began his famous experiments, he
was not entertaining any hypotheses involving superconductivity.
He was wondering what the y-intercept would be on the graph of
resistivity versus temperature; it had never occurred to him (or anyone
else) that the graph might have an x-intercept instead.
Example: When Jansky began his famous experiments, he was
not entertaining any hypotheses about radio astronomy. He spent
over a year taking data before he discovered that part of the signal
had a period of one sidereal day. At this instant – and not
before – the correct hypothesis came to mind: that part of the signal
was emanating from somewhere far outside the solar system. The point
is that a very great deal of scientific and engineering activity
preceded the historic hypothesis.
Looking back with 20/20 hindsight we can analyze and summarize
Jansky’s work in terms of hypotheses ruled out or not ruled out ...
but hindsight is not a useful method to the researcher who is doing
the original work.
Example: On the day when Fleming discovered penicillin, he was
not entertaining any hypotheses about penicillin, antibiotics, or
anything remotely similar. The key observation was the result of a
lucky accident. Of course, after the discovery, he considered various
hypotheses that might explain the observations, but the point remains:
the hypotheses came after the observations, and did not guide
the initial discovery.
Counterexample: At the opposite extreme, in a typical forensic
DNA-testing laboratory, two very specific hypotheses are being
entertained: Either sample A is consistent with sample B,
or it isn’t. This may be “scientific”, but it isn’t research.
Example: When the BATSE team discovered TGFs (terrestrial gamma
flashes), they weren’t looking for them. They were not “testing the
hypothesis” that TGFs exist. The spacecraft was intended to look for
cosmic gamma-ray sources. Then they noticed, hey wait a minute,
some of the flashes are coming from the wrong direction.
Example: Theoretical calculations (as in item 22)
usually do not proceed by means of hypothesis testing. If you are
asked to multiply 17 by 29, I suppose you “could” do it by testing a
series of hypotheses:
-
Is the product 0?
- Is the product 1?
- Is the product 2?
- ...
However, I don’t recommend that approach. Reliable and efficient
long-multiplication algorithms are available.
Theoretical physics involves a great deal of calculation. Overall, it
is not well described as hypothesis testing.
Example: The same goes for experiments. Even very simple
experiments are often not well described by hypothesis testing. If
you are asked to count the number of beans in a given jar, you could
contrive all sorts of hypotheses, just as we did in the previous
example:
-
Is the count 0?
- Is the count 1?
- Is the count 2?
- ...
However, none of those hypotheses would do you much good. At some
point, if you want an accurate result, you have to count the beans.
Bad Example: Christopher Columbus started out with the
expectation that he could sail to India. He did not do a good job of
considering all the plausible hypotheses. Instead, he picked one
hypothesis and more-or-less assumed it was true. The problem is that
when his expectation was not fulfilled, he tried to fudge the data to
conform to his expectation, rather than reporting what he actually
discovered. This is flagrantly unscientific behavior.
It is extremely common to set out expecting to discover one thing and
instead to discover another (e.g. Fleming, Jansky, Kamerlingh Onnes,
and innumerable others). This is so common that it even has a name:
serendipity. Serendipity is not blind luck. It is the opposite of
blind luck; it is the kind of luck that you earn by being smart,
keeping your eyes open, and visiting places where interesting stuff is
likely to occur.
As the proverb says: If the only tool you have is a hammer,
everything begins to look like a nail. Now, I have nothing against
hammers, and I have nothing against hypothesis testing. But the fact
remains that in many circumstances, hypothesis testing is not the
right tool for the job. Scientists know how to use many different
tools.
It is common for people who don’t understand science to radically
overemphasize the hypothesis-testing model, and to underestimate the
number of iterative stages required before a good set of hypotheses
can be formulated. It is a common but ghastly mistake to think that a
good set of hypotheses can be written down in advance, and then simply
tested.
Overemphasizing hypothesis-testing tends to overstate the importance
of deduction and to understate the importance of induction,
exploration, and serendipity.
3.8 Complete Set of Things That Could Happen
If you are going to think in terms of hypotheses at all, you should do
your best to consider all the plausible hypotheses, i.e. all the
plausible things that could happen.
For example, in a simple coin-tossing experiment, if you hypothesize
that the coin will come up heads, you should at least (!) consider the
hypothesis that it will come up tails. As mentioned in section 4, if an “experiment” has only one possible outcome, it’s not
an experiment; it’s just some kind of construction project or
demonstration. Even if you are repeating a conventional experiment
and expect the conventional result to be confirmed, you are at least
implicitly considering the possibility that it won’t be confirmed;
otherwise the whole exercise is pointless.
During the planning stage, you don’t need to consider in detail every
imaginable scenario, but you should do your best to consider all the
plausible scenarios. Even beginners should devise a
flexible plan, flexible enough to cover all the things that are
reasonably likely to happen.
First of all, you need to do this for safety. Secondly, you ought
to do this because it greatly increases the chance that the
experiment will be worthwhile.
After the planning stage, you should keep your eyes open, looking for
anomalies, i.e. looking for any kind of unexpected results. If the
preliminary experiments don’t go as planned, that’s useful
information. You can use that by going back to the planning stage,
formulating a better plan, and starting over from there. This
iterative process is very important.
There seems to be widespread misunderstanding of the role of planning,
prediction, and iteration. Science is not a guessing game. One of
the great advantages of being a scientist is that you don’t have to
guess! Instead, you make a list of all the plausible things that
could happen and proceed from there. This minimizes
the amount of guesswork, and minimizes the amount
of unwelcome surprises.
Consider a typical high-school science fair. The presentations
can be placed into three categories:
- Category I (bad): The “Conclusions” section starts out with the
statement that “The hypothesis was confirmed”.
- Category II (equaly bad): The “Conclusions” section starts out
with the statement that “The hypothesis turned out to be false”.
- Category III (good): A long list of hypotheses is presented. The
“Conclusion” section says something like “The results are
consistent with hypothesis #2. All the other hypotheses on the list
can be ruled out”.
At a typical science fair, there are appallingly few (if any)
presentations that fall into category III. This is no accident; the
students were taught to do things the wrong way, as you can see in
figure 5 in section 4.
What makes it worse is that generally the projects in category II are
severely downgraded relative category I. This is a travesty of
science, because it rewards guessing the answer in advance – or doing
“experiments” where the result is a foregone conclusion – as
opposed to doing an experiment that actually accomplishes something,
by telling you something you didn’t already know.
The students in category II would have been very much better off if
they had transferred to category III, that is, if they had considered
a larger set of hypotheses. This is the easiest thing in the world to
do, since you can rewrite the list of hypotheses after doing the
experiment.
When I am judging a science fair, I tend to downgrade everyone in
categories I and II equally, for failing to consider all the plausible
hypotheses. Science is not a TV show where “the” myth is either
busted or confirmed.
I do not give any preference to category I, because science is not a
guessing game, and especially because I don’t want to encourage doing
experiments where the result is a foregone conclusion.
This reminds me of how science was done in the old Soviet
Union. Scientists were rewarded for “successful” projects,
so they always did the work in advance, and then submitted
proposals to “discover” things they already knew about.
The thing that is extra-sad about category II is that in the real
world, scientists are free to change their list of hypotheses. They
routinely change the list again and again, iteratively, as they learn
more.
3.9 Exploring versus Publishing
As pointed out in reference 6 and reference 10, there is a
huge difference between how a scientific result is initially
obtained and how it is explained. It is an infamously
common mistake to confuse these two things.
|
When explaining a scientific result, the explanation
should be linear and logical.
|
|
When initially obtaining a
scientific result, the process is almost always messy and nonlinear.
|
|
A text or a scientific paper should say what we know, and
give the best evidence for it. This is all you need in order to
apply the result to practical problems. See
reference 18.
|
|
The real history involves a great
deal of backtracking out of blind alleys. The details are
interesting if you want to learn how science is done, but
uninteresting and irrelevant if all you want is the result.
|
After a goodly amount of data has been collected, it makes sense to
make a list of hypotheses, and to decide which are consistent with the
data and which are not. This a posteriori list of hypotheses
need not bear any relationship to whatever set of hypotheses (if any)
you had before seeing the data.
Sometimes – but not necessarily – a scientific paper can be
structured as a discussion of which hypotheses are consistent with the
data and which are not. It is not possible to consider every
imaginable hypothesis, so the list must be pruned to focus on the ones
that are a priori plausible and interesting. Here a
priori means they would have been plausible if you hadn’t done the
experiment. This is a way of highlighting what you learned by
doing the experiment.
Let’s be clear: This is how scientific results are (sometimes!)
published; it is not how they are obtained. If you see somebody
touting a cut-and-dried five-step approach to doing science, based on
hypothesis testing, it means they have read about scientific results
but never actually done any science, at least not any research or
exploration.
Here’s a quote from Andrew Wiles:
Perhaps I can best describe my experience of doing mathematics in
terms of a journey through a dark unexplored mansion. You enter the
first room of the mansion and it’s completely dark. You stumble
around bumping into the furniture, but gradually you learn where each
piece of furniture is. Finally, after six months or so, you find the
light switch, you turn it on, and suddenly it’s all illuminated. You
can see exactly where you were. Then you move into the next room and
spend another six months in the dark. So each of these breakthroughs,
while sometimes they’re momentary, sometimes over a period of a day
or two, they are the culmination of – and couldn’t exist without – the
many months of stumbling around in the dark that proceed them.
3.10 Hard Cases; Observation versus Experimentation
Consider the contrast:
|
When non-scientists try to guess how science is done,
all-too-often they imagine simple laboratory experiments, where the
scientist tightly controls all the relevant variables, makes changes,
and observes the results. This represents some sort of ideal case.
|
|
In real life, tightly-controlled laboratory experiments might be
physically impossible, prohibitively expensive, and/or unethical.
|
-
- Example: Astronomy is not well described in terms of experimentation.
Most of astronomy is an observational science, not an
experimental science. We lack the means to perturb stars and
galaxies; all we can do is observe. Being restricted to observation
rather than experimentation makes doing science very much harder.
Specialized scientific methods are required.
On the other hand, sometimes some aspects of the observations can be
checked by experiment. For example, stellar spectra can be compared
with laboratory spectra. However, the point remains: the
primary subject matter (including stars, galaxies, etc.) remains
beyond the reach of real experimentation.
- Example: Epidemiology often requires a considerable amount
of passive observation ... instead of or in addition to some amount
of experimentation.
- Example: Paleontology is not well described in terms of
experimentation (not counting Jurassic Park).
- Example: When conducting experiments on living subjects, it is
essentially impossible to control all the details. This does not mean
we should lower our standards, but it does make it very much more
difficult to conduct valid experiments. Experimenters should budget
accordingly. Some of the problems can be alleviated using randomized
controls and careful statistical analysis.
- Example: With human subjects – such as when
trialing a new drug – additional elaborate controls are necessary.
This requires double blinding (including placebos), et cetera.
- Example: In some cases – such as educational psychology – proper
double blinding is impossible or infeasible, which makes it even more
difficult to obtain reliable results. See reference 19 for
a discussion of some of the things that can go wrong, and procedures
for minimizing the damage.
3.11 Theories, Hypotheories, and Kyriotheories
As mentioned in item 7, the word “theory” can be used in two
radically different ways.
|
One usage refers to a coherent system of evidence,
principles, and methods, offering a comprehensive understanding of a
broad topic. (This is much grander than any single rule or fact.)
|
|
The
other usage refers to a hypothesis, conjecture, or mere speculation.
|
Remarkably, both usages are correct, and the ambiguity can be traced
back more than 2000 years. Both meanings are used by scientists and
non-scientists alike.
It is important to be aware of this, because the ambiguity is
routinely used as a a sucker-punch, used by persons who are attacking
science in general and evolution in particular. It is best to avoid
the word “theory” entirely when debating such persons. Don’t be a
sucker.
Here’s a constructive suggestion: When a word is ambiguous, we can
always coin new words. In particular, we can replace
the word “theory” with kyriotheory and
hypotheory. These words are complementary to the words thesis
and hypothesis (respectively), in the following sense:
|
A thesis is a statement you put forward and offer to
defend with evidence and logic.
|
|
A hypothesis is a statement
you put forward without offering to defend it. Indeed, in
a proof by contradiction, you put forward a hypothesis with
the intention of disproving it, not supporting it.
|
|
A kyriotheory is something you see that is supported by
comprehensive evidence and logic.
|
|
A hypotheory is something you see
that lacks support. It could have come from a hypothesis, a
conjecture, or a mere speculation.
|
Note that the words “thesis” and “theory” do not come from the
same root. They are complementary, in the sense that showing and
seeing are complementary; that is, they describe the same process from
opposite points of view.
The prefix “hypo-” comes from the Greek ύπο- meaning literally
“below”, hence lesser in stature or (figuratively) lesser in
importance. (The corresponding Latin prefix is “sub-”, which is
perhaps more familiar.)
The prefix “kyrio-” comes from the Greek κύριο- meaning
powerful, authoritative, masterful, or canonical. The English word
kyriolexy refers to using words according to their literal, canonical
meaning, as opposed to figurative or obscure meanings. Similarly, the
word “Kyrie” (meaning Lord or Master) shows up in liturgical and/or
musical contexts.
Here’s an example showing why these words are useful:
- * If somebody says “Oh, that’s just a theory” they must be
talking about a hypotheory.
- * The theory of evolution is not a hypotheory. It is a kyriotheory.
- * If somebody says “Evolution is just a theory” they don’t know
what they’re talking about. It’s not just a theory, it’s a
kyriotheory. It’s a comprehensive body of facts and logic.
Here’s another suggestion: You can always say what you mean
using plain English:
|
If you mean comprehensive understanding, don’t say “theory”
— say comprehensive understanding.
|
|
If you mean conjecture or
speculation, don’t say “theory” — say conjecture or speculation.
|
In particular, rather than
referring to Darwin’s “theory” of evolution, it would be better to
speak of our modern comprehensive understanding of evolution. (Darwin
made an epochal contribution to our understanding, but things didn’t
stop there. Nowadays Darwin’s evidence and reasoning are only a few
strands in a very large tapestry.)
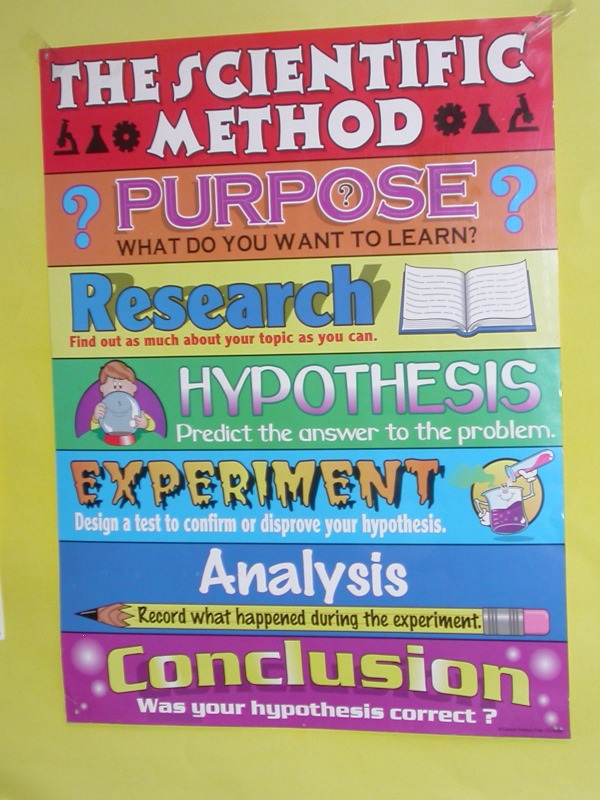
4 The Poster Version of The Scientific Method, Or Not
The poster shown figure 5 codifies a large
number of misconceptions. Such posters – and the misconceptions
they represent – are horrifyingly common.
As discussed in section 1, real scientists use many
methods. There is not any cut-and-dried method for doing science, just
as there is not any cut-and-dried method for writing a novel.
Here are some of the problems with the poster in figure 5.
- For starters, the poster speaks of «The Scientific Method» as
if this five-step procedure were the only way of doing science. In
fact, though, this is nonsense. Little if any science is done this
way.
As one example among many, theoretical physics and pure mathematics are
perfectly respectable sciences, just not experimental
sciences. They do not even remotely
conform to the experiment-based “method” described on the poster.
It is quite offensive to theorists to imply that their
work is not science.
- The poster portrays “Research” as being disjoint from
“Experiment” and also from “Analysis”. In reality, every
researcher I know uses the term “research” to cover
experimentation and analysis as well as studying the literature. It
is quite offensive to experimentalists to imply that
experimentation is not considered research.
- On the poster, the icon for “Research” is an open book.
There was a time, 1000 years ago, at the nadir of the dark ages,
when this might have been appropriate. Back then “research” meant
literally re-searching, i.e. searching (again) through ancient books
to see what the “authorities” said about the topic. However,
that’s not what the word means now. Let’s be clear: Research
includes experimentation and analysis as well as studying the
literature.
- The poster equates “hypothesis” with “prediction”. There
are at least three things wrong here.
- As a minor point of terminology, there is a dispute about
what the word “hypothesis” means. Many people have been taught
that it is equivalent to “prediction”... but that is not the
original meaning, and that is not how scientists use the word.
However, rather than arguing about terminology, it is (as always)
better to stop using the disputed terms and use better terms
instead. In this case we can use terms such as “scenarios” and
“outcomes” and “things that could happen”.
- Much more importantly: No matter what word is used, it needs
to be plural. That is, rather than thinking in terms of «the»
hypothesis, it is better to consider the entire range of
hypotheses (plural), i.e. to consider all the plausible
things that could happen. See also section 3.7
and reference 4.
If the so-called experiment has only one possible thing that
could happen, then it’s not an experiment, and it’s certainly
not research; it’s just some kind of construction project or
demonstration. See section 3.8.
|
If the “experiment” has only one possible outcome,
then it’s not an experiment.
|
|
|
|
This point is quite fundamental: In the early stages of a
scientific inquiry, it is not reasonable (let alone necessary) to
make a specific prediction. By way of analogy, if you were on a
jury, you would want to wait until after you heard the
evidence before deciding what the verdict would be. The same
idea applies to science. As a specific example, in connection
with the celebrated “twelve coins” puzzle
(reference 20), before the experiment is done there
is no way to make a meaningful prediction about the specific
outcome. Any specific prediction would be merely a wild guess,
the sort of thing you get from a crystal ball. It would be
unscientific as well as pointless.
After the experiment has been done, the situation is
different: We can predict that anybody else who measures the same
coins will get the same answer – but even then, we should at
least consider the possibility that the prediction could go
awry. (Furthermore, of course, if they measure different coins,
all bets are off.) Let’s keep things straight: Science makes
predictions based on the evidence. Making a wild guess before
obtaining the evidence is the opposite of science ... and the
opposite of common sense.
- Very commonly, in the early stages of a survey or exploration,
there could be millions or billions of possible outcomes. It
would be impossible even to list them all in detail, let alone to
consider them individually. Instead, one should put together a
flexible plan that can deal with a wide range of
eventualities. By way of example:
|
When Lewis and Clark started out, they were not testing the
specific hypothesis that they would find bighorn sheep in the
Rocky Mountains. Nobody on their team had ever heard of bighorn
sheep or heard of the Rocky Mountains.
|
|
Instead, they had
broad, flexible plans. They were hoping to find a wide range of
flora and fauna. They weren’t hoping to find humongous jagged
mountains athwart their path, and they were not even sufficiently
prepared for the possibility. They had to improvise and get help
along the way.
|
- On the poster, the icon for “Hypothesis” is a crystal
ball. That’s quite offensive to real scientists. Please do not
equate science with occultism.
- The poster says the “Experiment” must be “a test to confirm
or disprove your hypothesis”. This is just wrong. Many excellent
scientific experiments, especially exploration and surveys, do not
fit the hypothesis-testing mold. Also, serendipitous discoveries –
including many of the all-time most-important discoveries – do not
fit this mold.
- The poster says the “Conclusion” of the scientific method
equates to asking “Was your hypothesis correct?” This is wrong
several times over.
- First of all, as Kuhn pointed out in reference 6, no
hypothesis is ever proved correct. If we choose to mention
hypotheses at all, the most we can say is that some of the
hypotheses remain consistent with the data, while others are ruled
out. The notion of “consistency” is much weaker than the notion
of proven “correctness”.
- Secondly, if/when you get to a point where it makes sense to
have hypotheses, there will be multiple hypotheses (not just one),
so asking about “the” hypothesis makes no sense at all.
- Science is not a guessing game. Nobody cares what your
preconceived notions might have been. Nobody cares what your
original hypotheses (if any) might have been, back before the
experiment was done. The latest and greatest results of your work
are what matter. At any stage in the process, including the
near-final stage where you write up your conclusions, you are free
to revise the list of hypotheses. If none of your
original hypotheses are consistent with the data,
you need to think up one or more
new hypotheses that are consistent with the available
data, and include them in the final set of hypotheses.
I emphasize this point because it is so very harmful to require
a young scientist to guess what the outcome of the experiment will
be, and even more harmful to judge the work according to whether
the preconceived notions were correct. It destroys
curiosity, originality, and creativity. See
section 3.8.
- According to the poster, “Analysis” is equated with simply
recording what happened during the experiment. In contrast, in the
real world, analysis means something quite different.
You could use a simple video camera to record what happened
during the experiment, but that would not count
as analysis. Not even close. Actual analysis includes
calculations, incisive thought, cross-checking facts and theories
against each other, and the formation of new ideas.
- In addition to what is on the poster, we must take note of
something that is conspicuously missing from the poster, namely any
idea of iteration, the idea that after doing some experiments and
some analysis you may need to go back and do another literature
search, do some more-refined experiments, do more analysis, and so
on iteratively. This is discussed in connection with figure 7 in section 5.
Somebody tried to tell me that a feedback arrow, to
symbolize iteration, would have been out of place on
this poster, because the idea is too complex. I pointed
out that in another classroom down the hall from where
I spotted this poster, younger
students were being shown a poster of the life cycle
of an insect, and in a classroom farther down the hall,
yet-younger students were being shown a poster of the
hydrologic cycle. Does this mean that as the students
progress through the school, they become dumber and
dumber, to the point where they can no longer understand
cycles?
- Last but not least ... did you notice the font used for the
word “Experiment”? Fonts of that sort, using looming,
keystone-shaped, drippy letters are classified as “horror fonts”.
They are a cliché symbolizing the blood-drenched evil mad
scientist, as in figure 6.
I have to wonder, did the folks who created the Scientific Method
poster in figure 5 choose this font specially
because they wanted to offend scientists in general and
experimentalists in particular? ... Or did they choose it because
the only scientists they knew anything about were the villains in
monster movies?
In the interests of fairness, it must be pointed out that not
everything on the Scientific Methods poster is terrible. In
particular, the second item is OK. Scientific activities should have
an identifiable purpose. Sometimes the purpose is a bit vague, for
example when exploring unknown territory in hopes of discovering
“something” ... but still there is a purpose, and the effort is
expected to pay off on average.
There is a proverb to the effect that “you can’t beat something with
nothing”. That is to say, even though the poster is worse than
nothing, it’s hard to ask people to rip down the poster shown in
figure 5 unless you can offer some sort of
replacement. A possible replacement is discussed in section 5.
Other possible replacements are provided by reference 21.
5 Iteration, Collaboration, and Communication
With occasional exceptions, science is a highly social activity. It
involves huge amounts of collaboration and communication in various
forms. This is not the sort of thing that most people think of when
you mention “the scientific method” but it is a very big part of how
science is really done. Writing a paper at the end of the project is
part of what we mean by communication, but nowhere near all of it.
The process is also highly nonlinear. That is to say, it is
iterative, with lots of loops within loops.
In some cases, it proceeds roughly as shown in figure 7, and as described in the following story.
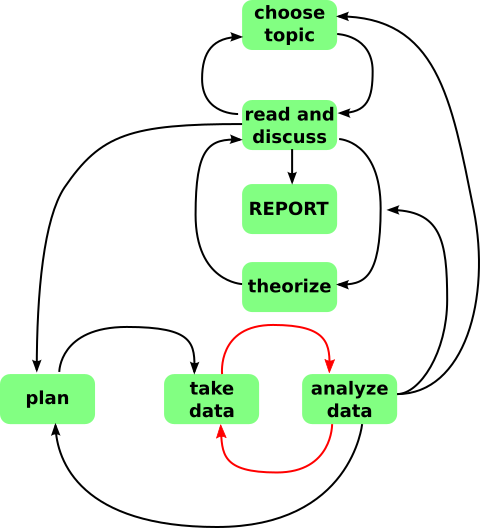 Figure 7
: Simplified Outline of
Some Science Projects
- You come up with an idea. You work on it for a while. Working
on it includes reading what other folks have said about the topic.
- You keep working on it until it reaches the half-baked stage.
At this point, you know what you want to do and you have an outline
of how to do it. You know how to fill in the details for some steps
in the outline, but not others. Intuition suggests that filling in
the missing steps ought to be a solvable problem.
- You take the half-baked idea to your best buddy.
The first time, he shoots it down immediately, pointing out that one
step in your outline violates some famous theorem that you should have
known about. So you give up on that idea. Eventually you come up
with a new idea, and start over at step 1.
Eventually you come up with an idea that withstands preliminary
scrutiny. Your buddy helps by filling in some of the missing steps.
- You start sharing the idea with a wider circle. You practice
explaining the idea. It is proverbial that you don’t really
understand something unless you can explain it to somebody else.
Down the hall there is a senior guy who is very knowledgeable and
famously skeptical. If you can explain it to him, and he doesn’t find
anything wrong with the argument, you’re on the right track.
Also you practice explaining it to non-experts, including people from
other disciplines and/or students. This tells you how much background
information you must provide to a non-expert to make the story
comprehensible.
- In the course of explaining it to people, you pick up
collaborators. You might stumble across somebody who can instantly
tell you how to resolve one of the open issues ... or who is at least
interested in figuring it out. If you have a novel theoretical idea,
you can recruit experimentalists to help do the experiment.
Conversely, if you have a novel experimental observation, you can
recruit theorists to help figure out what it means.
In an industrial research situation, at some point you explain the
idea to your department head. It’s his job to round up the resources
– including additional team members – you need to finish the
project. In the academic world there are guys who play a similar
role. That is, they know what everybody else is doing, and can fix
you up with a potential collaborator whom you might not otherwise have
met.
At this point, you have a team. It’s a loose-knit informal team.
Each person might belong to many different teams at the same time,
working part-time for each of them.
- Gradually the team fleshes out the idea. You work inward,
filling in the missing steps. You also work outward, figuring
out the implications and ramifications.
- Before doing any serious experimentation, you make a plan. The
plan should cover all the plausible scenarios, all the plausible
hypotheses. This is necessary for safety if nothing else. Depending
on the costs and risks involved, the plan might be very simple, or it
might be very complex and detailed.
The plan should be as flexible and open-ended as possible, within
reason. This may involve grouping possible outcomes into general
categories, and dealing with things category-by-category rather than
detail-by-detail.
You do not need a crystal ball or a Ouija board to predict “the”
outcome, precisely because the plan covers all the plausible
outcomes.
- Do not wait until the experiments are complete to start
analyzing the data. Experimentation and analysis should be
concurrent. This is important because it allows you to notice if
something is going wrong with the experiment. On the other side of
the same coin, this is what makes serendipity possible. This is the
tight loop shown in red in the diagram.
- Based on preliminary experiments, you might decide you need to
come up with a new theory, or a new experimental plan, or maybe even a
new topic.
- Eventually you need to give a seminar on the subject. In
preparation, you make a bunch of slides.
You start by giving a practice talk in front of a tiny audience,
perhaps just one expert and one non-expert. At the end of the talk,
they critique your talk, slide by slide ... and also critique the talk
overall. You redo the slides to incorporate their suggestions. You
give another practice talk and iterate until it converges to something
that is clear and correct. That is, clear enough for the non-experts
to follow, and correct enough to keep the experts happy.
At this point you give the talk to larger audiences.
Giving talks is also part of the process of recruiting collaborators.
Some people will start by replicating and verifying the work. Others
will build on the work, adding new layers of ramifications.
- After you have given the talk a few times, you’re ready to write
a formal scientific paper. This goes through many many drafts. All
the team members have to check it and sign off on it. You also obtain
an “alpha” review from a friendly in-house expert.
Eventually it gets published in a journal, where everybody in the
field can read it. You can also put the paper on the web, where yet
more people can read it.
- Beware that this is a cartoonishly oversimplified outline of
what really happens. See also reference 21 for some
flowchart posters and some intelligent discussion of how science is done.
In some cases, good way to organize the report might be to list a set
of interesting hypotheses that are consistent with the results, plus
another set of interesting hypotheses that are ruled out. However,
this is not the only format, or even the usual format.
If there is a list of hypotheses, it probably bears little or no
resemblance to the list of scenarios you considered during the
planning stage. The report should present what you actually learned
from the data – not what you thought you would learn. Science is not
a guessing game. You get credit for what you actually did, regardless
of what you initially thought you were going to do. The purpose of
the plan is to provide for safety and to provide for efficient use of
resources. The plan is absolutely not a binding contract. It does
not constrain the outcome of the work or the format of the report.
The plan should be flexible, whereas the report should be specific.
Keep in mind the example of Lewis and Clark: They reported, quite
specifically, finding bighorn sheep in the Rocky Mountains. There was
nothing like that in the initial plan, nothing nearly so specific, for
good reason. It was, however, within the general category of things
of things they had planned for.
It takes judgment to decide which hypotheses, if any, to discuss in
the report. You need to limit it to interesting hypotheses.
Note that there are always an infinite number of uninteresting
hypotheses. For example, the hypothesis that 2+2=13 is almost
always ruled out, but it is not worth discussing.
See section 3.9 for more discussion of how results
are explained, and how this differs from how they are obtained.
6 Approximations, Assumptions, and Uncertainty
6.1 Approximations
In science as in daily life, it is necessary to make approximations,
as mentioned in item 3. For example, when you buy shoes,
you don’t buy a pair that is exactly the right size; you buy a pair
that is close enough to the right size.
Elementary arithmetic is exact, in the sense that 2 plus 2 equals 4
exactly. In contrast, physics, chemistry, biology, etc. are not
exact sciences; they are natural sciences. For example,
Newton’s law of universal gravitation:
|
FI = G | |
(3) |
is one of the greatest triumphs in the history of human thought
… but we know it is not exact. It is a very good approximation
when the gravitational field is not too strong and not changing too
quickly. It is also misleading, because FI is not the only
contribution to the weight of ordinary terrestrial objects; there are
significant correction terms from other sources including the rotation
of the earth, as discussed in reference 22.
It is a common mistake to treat all approximations as equally good, or
equally bad.
-
Some people are disappointed when they discover that
this-or-that rule is “only” an approximation, and they
refuse to use the rule, even though it is a very good approximation.
- At the other extreme, when an approximation is necessary,
some people use the first approximation that comes to mind, even
though it is a terrible approximation and much better approximations
are readily available.
To say the same thing another way, when you are in a situation that
requires making an approximation, that does not give you a license to
make a bad approximation. It’s your job to figure out what’s good and
what’s bad.
It is not always easy to distinguish good approximations from bad
approximations. It requires knowledge, skill, and judgment.
6.2 Uncertainty
Science rarely offers certainty. Often it offers near certainty, but
not absolute certainty. (This is in contrast to religion, which
sometimes offers absolute certainty, and to things like elementary
arithmetic, which offers absolute certainty over a limited range.)
One of the surest ways to be recognized as a non-scientist is to
pretend to be certain when you’re not.
The world is full of uncertainty. It always has been, and always will
be. You should not blame science for “causing” this uncertainty,
and you should not expect science to eliminate this uncertainty.
Instead, science tells us good ways to live in an uncertain world.
Techniques for quantifying uncertainty are discussed in
reference 3.
6.3 Questioning Assumptions
As mentioned in item 19, it is impossible for anyone to do
anything without making assumptions.
Remember that a major purpose of scientific methods is to make useful
predictions and to avoid mistakes. False assumptions are a common
source of serious mistakes.
At this point, non-experts commonly say “don’t make assumptions” or
perhaps “check all your assumptions”. Alas, that’s not helpful.
After all, most assumptions are true and useful ... otherwise people
wouldn’t assume them. The trick is to filter out the tiny minority of
assumptions that turn out to be false. This is far easier said than
done. There are too many assumptions, and it is impractical to even
list them all, let alone check them all.
The real question is, which assumptions should be checked under
what conditions? There is no easy answer to this question.
Assumptions can be classified, approximately, as explicit
assumptions and implicit assumptions. Explicit assumptions
are the ones you know you are making. They are usually not the
main problem; you can make a list of the explicit assumptions
and then check them one by one.
The big trouble comes from implicit assumptions that aren’t quite
true. This includes things that “everybody knows” to be true, but
are not in fact true, as discussed in reference 16. They
also include rules that have become invalid because you have mistaken
the provisos, as discussed in section 3.4.
Skilled scientists can question assumptions somewhat more quickly and
more methodically than other folks, because they have had more
experience doing it. But it’s never easy. All of us must rack
our brains to figure out which assumptions have let us down.
It always looks relatively easy in retrospect. Once somebody has
identified the assumption that needed repair, it is easy for everybody
else to hop onto the bandwagon.
One sometimes-helpful suggestion is this: If you find a contradiction,
inconsistency, or paradox in what you “know”, that is a good reason
to start questioning assumptions. Start by questioning the
assumptions that are most closely connected to the contradiction.
Some scientists keep lists of paradoxes. If an item stays on the list
for a long time, it means there is a problem that is not easily
solved, and the solution is likely to be a turning point in the
history of science. Examples from the past include the Gibbs paradox,
the black-body paradox, various paradoxes associated with the
luminiferous ether, the Olbers paradox, et cetera.
An important component of science, especially of scientific
research, involves exploring new territory. Commonly
assumptions that were valid in the old territory break down in the new
territory. Indeed when researchers choose where to explore, they
often seek out situations where assumptions can be expected to break
down, since that will reveal new information. For more on this, see
section 8 and reference 23.
|
In ordinary applications, when you want to rely on the model,
you should stay safely within the limitations of the model.
|
|
In
research mode, where the model is the object of research, you are
testing the model, not relying on it. Then it makes sense to patrol
along the boundaries, to see if the limits need to be tightened or
loosened. It also sometimes makes sense to go far beyond the limits,
in hopes of making a surprising discovery.
|
7 Discovery and Invention
As discussed in section 3.7, we should not overemphasize
hypothesis testing. On the other hand, we should not overemphasize
serendipity, either.
All too often, people tend to draw boundaries where no real boundaries
exist, and tend to focus on the extremes when reality lies in the
middle, far from any extreme. The following table shows some
of the wrong ways to look at the situation:
| science | ?versus? | engineering |
| research | ?versus? | development |
| discovery | ?versus? | invention |
| spontaneous | ?versus? | scripted |
| serendipity | ?versus? | hypothesis testing |
| inspiration | ?versus? | perspiration |
|
To repeat: reality lies in the middle, usually far from any extreme.
The table is typeset on a red background with lots of question marks,
to warn you that it is unwise to make the distinctions on each row,
and unwise to equate things in each column.
|
At one extreme, it would be a mistake to think that research
is precisely guided by pre-existing hypotheses.
|
|
At the opposite
extreme, it would be a mistake to think that research is conducted at
random, with no idea what to look for or where to look.
|
Many things that are touted as “big discoveries” were actually
developed, step by step, combining many small discoveries and many
small inventions.
By way of example, when people found out about the magnetrons used for
radar in World War II, they assumed it had been a sudden discovery.
Actually it had been the subject of years of intense research and
development, but the work had been kept secret.
As another example, Pierre and Marie Curie announced in 1898 the
“discovery” of radium, but then they had to slave away in a decrepit
shed for several years before they could isolate a pure sample and
determine just how radioactive it was.
Thomas Edison said that inventing was 1% inspiration and 99%
perspiration. I don’t want to argue about the exact percentages; the
crucial point is that both are necessary. Inspiration alone won’t get
the job done. Perspiration alone won’t get the job done.
I am reminded of the rock star who said it took him 15 years to become
an overnight sensation.
8 Well-Managed Risks
Scientists understand probability and statistics. By definition, you
can’t make a particular fortunate accident happen on demand, but you
can work in an area where valuable discoveries are likely to be
made from time to time. Everybody must accept some risk. For
example, any sensible farmer knows there is some risk that a freak
storm will destroy his entire crop. The key idea is that successful
crops are sufficiently common – and the crop is sufficiently valuable
– that the farmer makes money on average.
Scientists do not accept all risks, nor do they decline all risks.
They accept risks that are likely to pay off well on average.
See reference 23 for more on this.
9 Correctness and Modesty
As mentioned in item 2, a major purpose of scientific methods is to
make useful predictions and to avoid mistakes. The known scientific
methods are a collection of guidelines that have been found to work
reasonably well.
One of the most important steps in avoiding mistakes is to always keep
in mind that mistakes are possible. This is so important that this
whole section is devoted to emphasizing it and re-expressing it in
assorted ways.
James Randi said you should take care not to fool yourself, keeping in
mind that “the easiest person to fool is yourself”.
Another word for this is modesty. Being aware of your own fallibility
is modest. Pretending you are infallible is immodest.
It is OK to a limited extent to be an advocate for your favorite idea,
but you must not get carried away. When you collect data in support of
an idea, you must also look just as diligently for data that conflicts
with that idea. See section 10.3.
A related form of modesty, which is also crucial for avoiding
mistakes, is to not overstate your results. Scientists use certain
figures of speech that are designed to avoid overstatement. Among
other things, this includes recognizing the distinction between data
and the interpretation that you wish to place upon the data. As an
illustration, imagine some children go on a field trip to the
dairy. Upon their return, they write a childish report that says
“cows are brown” – or, worse, “all cows are brown”. A more
modest, scientific approach would be to say “the cows we observed
were all predominantly brown”. A statement about the observed cows
sticks closely to the data, while a generalization about all cows
requires a leap beyond the data.
As mentioned in item 11 and section 3.4, practically
all scientific results have some limits to their validity, and you
must clearly understand and clearly communicate these limits.
10 Experimental Techniques
Here is a very incomplete sketch of some of the issues that
arise when taking data. (This stands in contrast to the rest of
this document, which mostly emphasizes the analysis phase.)
10.1 Design of Experiment
Consider the famous Twelve Coins Puzzle as discussed in
reference 20. Suppose you find a casino that is willing to pay
you $350 for identifying the odd coin, but makes you pay
$100 for each weighing. If you weigh the right combinations of
coins, you can do the job in three weighings, so you make money every
time. In contrast, if you follow a sub-optimal strategy that requires
four or more weighings, you will lose money on average.
This scenario is reasonably analogous to many real-world situations.
Commonly there’s a significant price for making a measurement, and you
want to maximize the amount of information you get for this price.
I mention this because all too often, people claim that a principle of
scientific experimentation is to “change only one variable at a
time”. It’s easy to see that such a claim is not reliably true.
The Twelve Coins Puzzle (reference 20) is one
counterexample among many. If each weighing differs from the previous
weighing by only one coin, you cannot come anywhere close to an
optimal solution.
As discussed in reference 24, the suggestion to
“change only one variable at a time” might nevertheless be good
advice in some special situations. That’s because the cost of making
a measurement is not always the dominant cost in the overall
information-gathering process. For example, imagine a situation where
gathering the raw data is very cheap, while just plain thinking
about it is expensive. Then you might want to follow a strategy, such
as changing only one variable at a time, that makes the data easy to
interpret, even though you had to do a large number of experiments
(much larger than theoretically necessary).
10.2 Human Factors
When an experiment involves human collecting or selecting the data,
and especially when there is a task involving human subjects,
elaborate strict measures must be taken to maintain the integrity of
the results.
The problems that can arise are numerous, varied, and often subtle.
Some of the variations have names of their own, including:
-
placebo effect
- Hawthorne effect
- Clever Hans effect
- observer bias
- et cetera.
Techniques that can be used to defend against such problems include
placebos and blinding (especially double blinding), plus the use of
thoroughly randomized control groups.
For example, if an observer is interviewing a subject, it is all too
common for the interviewer to telegraph the desired answer. Double
blinding means that neither the interviewer nor the subject knows
what answer is desired, so this particular problem cannot arise.
There have been notorious cases where forensic labs “helped”
prosecutors by reporting false DNA matches, false bullet matches, et
cetera. It is very difficult to prevent this. At the very least
there must be strict blinding. There must also be careful calibration
against samples from a suitable control group. Last but not least,
there must be scrupulously independent testing, to detect departures
from protocol in general, and false matches in particular.
Even when there is no human subject, for instance if a human observer
is looking at an inanimate dial, there are many ways that bias can
creep in. Sometimes blinding helps, but there may be serious
practical disadvantages to this. Nowadays often the simplest thing
to do is to digitize the readings and stream them into a file
on a computer ... either instead of or (preferably) in addition to
having a human observer.
10.3 Fair Sampling
It is OK to a limited extent to be an advocate for your favorite idea,
but you must not get carried away. When you collect data in support of
an idea, you must also look just as diligently for data that conflicts
with that idea. Then you must weigh all the data fairly, and disclose
all the data when you discuss your idea. (If you don’t do this it is
called “selecting” the data, which is considered a form of scientific
misconduct.)
The same applies to theories: It does not suffice to show that your
favorite theory does a good job of fitting the data. You should
diligently search for other theories that do a comparably good job of
fitting the data.
This is what sets science apart from debating and lawyering,
where advocacy is carried to an extreme, and it is considered
acceptable to skip or make light of data that tends to support the
“opposing side”.
Before discussing the principles, let’s look at a couple of
example scenarios.
Scenario #1: Suppose you are tossing a coin, perhaps to generate
random numbers for use elsewhere, or perhaps to test whether the coin
is fair. As mentioned in item 15, section 2,
section 3.7, and especially section 3.8, you
should consider all the plausible outcomes. One way to do this
is as follows:
-
- Outcome #1: The coin lands
on the table heads-up.
- Outcome #2: The coin lands on the table
tails-up.
- Outcome #3: Neither of the above.
In this scenario, outcome #3 is a “catch-all” hypothesis.
Perhaps the coin misses the table and lands on the floor. Perhaps a magpie
steals the coin and flies away with it before you can determine
whether it is heads-up or tails-up. The nice thing is about this
hypothesis is that we can write it down without specifying all the
details. We do however need to know one crucial detail, as you
can see from the following contrast:
|
Suppose the failure of the coin to land on the table is not
correlated with whether it would have landed heads-up or tails-up. In
this case, we can simply veto the aberrant events. We toss another
coin and continue.
|
|
Suppose the failure is correlated with what
the outcome would have been. Perhaps a particularly malicious magpie
is more likely to steal the coin if it is heads-up. Perhaps one side
of the coin is slippery, making it more likely to slide off the table.
In such a case, it is not acceptable to simply veto the aberrant
events, because this would introduce a bias into the results.
|
So, the key point is, we need to understand outcome #3 well enough to
make sure it does not introduce any bias. We hope we can determine
this without understanding every detail.
In science, depending on context, the phrase “selecting the data”
can have very nasty connotations. For example, if we hear that
“so-and-so was accused of selecting the data” it means that he
allegedly manipulated the data so to introduce a bias.
|
Sometimes this is done for bad motives, with the intention of
supporting some preconceived notion.
|
|
Sometimes this is done for
seemingly-good motives. Sometimes people think they can “improve”
the data by rejecting data that is “implausible” or “out of range”.
|
It must be emphasized that this is considered misconduct, no matter
what the motives. Don’t do it! Even in routine situations, it
introduces a bias into the results. Perhaps more importantly, it
deprives you of the chance to make a non-routine discovery, by
figuring out why the data is out of range.
Here’s another scenario involving a catch-all hypothesis: Suppose we
want to compute the average aspect ratio of eggs, i.e. the ratio of
length to width. There are millions of eggs available, and we can’t
afford to measure them all, so we choose a subset and measure that.
We must make sure that the sample is chosen in such a way that no bias
is introduced.
The experiment can have various outcomes. We can categorize
them as follows. For each egg:
-
- Category #1: We measure and record the aspect ratio.
- Category #2: We somehow fail to record the aspect ratio.
For example, perhaps the egg falls to the floor and gets smashed
before the measurements are complete. Again, we must
be careful. There are two possibilities:
|
Suppose the breakage is uncorrelated with the aspect ratio.
In such a case we can veto the broken egg and measure another
instead.
|
|
Suppose that high-aspect-ratio eggs are more likely to be
dropped. This could seriously degrade the aspect-ratio measurement.
If there is any significant chance of this, we need to account for it,
or redesign the experiment to prevent such problems, and start over.
|
So, here are some principles:
- Ideally, you should make sure that any
lost or vetoed data is uncorrelated with whatever you are trying to
measure.
- In slightly non-ideal cases, there may be some small
correlation, in which case you should account for it and
apply a correction factor.
- In some cases, you need to redefine what it is you are
measuring. The details of the selection process become part of the
definition of what you are measuring. For example, you can
measure the height of a group of basketball players. That is OK so
long as you don’t think that basketball players are representative of
the population at large.
- Vetoing out-of-range data is a notorious source of serious
error. Therefore you should design your experiments with plenty of
dynamic range and plenty of “headroom” so as to minimize the
chance getting out-of-range data. If you ever do get out-of-range
data, you have to analyze how much distortion that introduces into
the measurement you are trying to make. Such an analysis is usually
difficult and sometimes impossible.
- Roundoff errors are another notorious problem. To avoid this, record
the raw data using plenty of guard digits. Do the analytical
calculations using plenty of guard digits. See
reference 3.
Recall that a measurement generally has both a nominal value and an
uncertainty (“error bars”) as discussed in reference 3.
Vetoing out-of-range data is particularly likely to distort the error
bars, which is unacceptable, even if the nominal value is not greatly
affected.
- If you are careful, it is OK to do a practice run, then do a for-real
run, and publish only the real data. You must, however, decide
in advance which runs are for practice and which runs are for
real. Otherwise this could become a nasty scheme for selecting the
data. In particular, performing run after run until you obtain the
“desired” result is completely unacceptable.
In advanced experiments, it is sometimes necessary to have a
trigger or veto or triage mechanism, i.e. some rule
that selects which data will be kept and which will be discarded.
Doing this right is very, very tricky ... so tricky that usually it is
simpler, cheaper, and all-around better to just keep all the data.
Also: when you write up your results, you should describe the trigger
criterion in detail, so that readers can judge for themselves whether
the trigger introduced any significant bias.
To repeat: The phrase “selecting the data” may not sound nasty
the first time you hear it, but the connotations are very nasty
indeed. There are various things that could be going on:
-
fraudulently selecting the data
- incompetently selecting the data
- legitimately sampling or triggering
The burden of proof is on you, to show that whatever you are doing
is legitimate, i.e. that it does not bias the conclusions.
10.4 Pilot Plants, Practice Runs, and Feedback Loops
Keep in mind the common-sense principle that you should never put yourself
in a position where the first mistake is fatal.
In the real world, scientists and engineers do simulations and dry
runs. They build pilot plants before committing to full-scale
operation, so that most of their mistakes will be small mistakes.
Therefore you should arrange your experiment so that you can take some
data, then do some analysis, and then come back and take some more
data. This allows feedback from the analysis phase back to the
data-taking phase, so that you can improve the data-taking if
necessary.
This is all the more important for students who are, after all,
students not experts, and can be expected to make mistakes. Yet we
want students to get good results in the end.
If at all possible, arrange it so that analysis (at least some sort of
preliminary analysis) happens in real time, so that if anything funny
happens during the experiment, the experimenter knows about it,
for reasons explained in section 10.5.
10.5 Why You Need Feedback
Let me tell a little story. Once upon a time in a mythical place
called La Jolla there was a fellow named John who really liked
numbers. The more digits the better. He wanted unbiased numbers so
dearly that he would have his grad student, Richard, face the
instrument with his eyes closed; when John said “Now!” Richard would
momentarily open his eyes and observe the number. John would write it
in the lab book. After doing this for many days and weeks, they had
lots of lab books filled with lots of numbers.
They were looking for some sign of a superfluid transition in liquid
3He at low temperatures. John had already made a string of important
discoveries in low-temperature physics, and finding the superfluid
would move him from pre-eminence to immortality.
Aside: The nice thing about theoretical predictions is that there are
so many to choose from. Predictions of Tc started at
about 300 millikelvin. When that was disproved experimentally, the
predictions moved to lower temperatures: 100 mK was disproved; 50 mK
was disproved; 30 mK was disproved; 10 mK was disproved. In fact John
and Richard had checked experimentally down to less than 2.5 mK
without seeing anything. So the theorists gave up and lowered their
prediction to something in the microKelvin range.
Once upon the same time, in a mythical place called Ithaca, there were
a couple of guys named Bob and Doug. They liked numbers OK, but they
also liked graphs. They wanted to see the data. And they
didn’t want to wait until the experiment was over to analyze the data
and see what it meant; they wanted to see the data in real time. This
is in the days before computers, so if you wanted a graph you had to
suffer for it, fooling with Leeds chart recorders, i.e. mechanical
contraptions with paper that always jammed and pens that always
clogged.
One Thursday in late November, Doug was watching the chart as the cell
cooled through 2.5 mK. There was a glitch on the T versus t
trace. Doug circled it and wrote “Glitch!!” on the chart. He
warmed back up and saw it again on the way up. And then again on the
way back down. He called Bob. Bob put down his plate of turkey and
zoomed into the lab. The two of them stayed up all night walking back
and forth through the “glitch”.
I’ve seen that chart. It doesn’t look like what I would call a
glitch. It’s more of a corner. A small-angle corner, just a
barely-visible departure from the underlying linear trend. Eyes are
good at spotting corners in otherwise-straight lines.
Doug and Bob assumed, based on the aforementioned experimental and
theoretical evidence, that this wasn’t the superfluid transition.
They figured it was something going on in the nearby solid 3He.
But they eventually figured out that it was indeed the superfluid.
Right there at 2.5 mK.
Everybody assumes that if John and Richard had been plotting their
data on a strip-chart recorder, they would in fact have discovered the
superfluid. But they didn’t.
Now, imagine what it was like working in Bob’s lab after that. With
strictness bordering on fanaticism, strip-chart recorders were
attached to all the significant variables ... and even some of the
not-very-significant variables.
Every so often, a new baby grad student, his fingers stained N
different colors from trying to unclog the chart pens, would ask
whether we really needed all those chart recorders. Somebody would
explain by saying, Once upon a time in a mythical place called La
Jolla, .......
10.6 Keep Good Records
Lab notebooks are not supposed to be perfect. If there are no
mistakes in the lab book, the lab book is presumably a fraud. You
are allowed to mark bad data as bad, but you are not allowed to
obliterate it or eradicate it. See reference 25 for an
example of a well-kept lab book containing a correction.
Perfection is not required;
deception is not allowed.
|
|
|
|
You are not allowed to “clean up” the books. You are certainly not
allowed to keep two sets of books (a dirty one to record raw data, and
a clean one to show off).
There are many reasons for keeping good records. First and foremost,
you and your collaborators need the information on a day-to-day basis.
During the analysis phase, it is all-too common to find that the data
cannot be analyzed, because even though the nominal result of the
measurement was recorded, the conditions of the measurement were
not adequately recorded. There’s no value in knowing the ordinate if
you don’t know the abscissa.
As mentioned in section 10.3, record all the data. If
possible, hook up a computer to stream all the data into a file.
Record the abscissas as well as the ordinates.
The rule is to keep good records. It is traditional to keep data in a
so-called lab book, aka laboratory notebook, which is one way of
keeping records, but not the only acceptable way. Good electronic
records are an acceptable alternative, and are in some ways better.
For example, if a witness signs and dates a page in a lab book, a bad
guy might be able to add something to the page later. Sometimes this
is detectable, but sometimes not. (Don’t try it.) In contrast, if an
electronic document is cryptographically signed, there is no way to
alter any part of the document without invalidating the signature.
There are various ways of obtaining unforgeable date-stamps on
electronic documents; see reference 26 for an example. If you
don’t want to bother with that, one option is to just email the
document (or a hash thereof) to your lawyer, with a cover letter
saying that you are not asking him to take any action, just to file
away the document, so that if there is ever any dispute he can
authenticate the date. Note that if the document is huge and/or
highly sensitive, you don’t need to send the document itself; it
suffices to send a cryptologic HMAC (hashed message authentication
code).
For things like blueprints, circuit diagrams and computer programs,
electronic records have huge advantages. The point is that such
things get revised again and again, and if you just have “the”
document, you have no idea who contributed what when. In contrast,
a modern revision control system such as git will conveniently
keep track of the current version and all previous versions. It
also keeps track of who submitted what changes, and when. Submissions
can be digitally signed.
If you are collaborating with people at other locations, electronic
documents have tremendous advantages.
If you are stuck with an ordinary lab book, and you want to revise or
annotate a page after it has been signed, one good way is to attach a
sticky note to the page. The note should refer the reader to a later
page where your latest&greatest thoughts can be found. Using a sticky
note guarantees you can’t be accused of altering the page after it was
signed.
In addition to helping you and your collaborators directly, good
records have other uses. They are particularly important in
connection with patents. Questions about inventorship and priority
come up a lot. I’ve seen it first hand, many times. Once I came out
on the short end of the stick, which didn’t bother me, because the
other guy had records that convinced everybody (including me) that he
invented the thing a month before I did, fair and square. More
commonly though, one claimant has copious records documenting the
gradual evolution of the invention, while the other claimant is just a
pretender, with nothing but a bold assertion covering the final,
perfect result. Sometimes disputes arise after an application has
been filed or after a patent has been granted, but in a large company
or large university, disputes can arise intramurally, before the
application is filed, when the lawyers try to figure who should be
named as inventor(s) on the application.
You should ask your patent attorneys what they want your records to
look like ... and then ask them what they will settle for. It seems
some lawyers would “prefer” to see every detail recorded in a lab
book, then signed and notarized in triplicate ... but they will settle
for a lot less formality.
11 References
-
-
John Denker,
“Weird Terminology”
www.av8n.com/physics/weird-terminology.htm -
P.B. Medawar,
The Limits of Science (1960) p.51. -
John Denker,
“Measurements and Uncertainties”
www.av8n.com/physics/uncertainty.htm -
John Denker,
“How to Define Hypothesis”
www.av8n.com/physics/hypothesis.htm -
National Science Teachers’ Association,
“The Nature of Science”
http://www.nsta.org/about/positions/natureofscience.aspx -
Thomas Kuhn,
The Structure of Scientific Revolutions -
John Denker,
“Learning, Remembering, and Thinking”
www.av8n.com/physics/thinking.htm -
Richard Feynman,
The Character of Physical Law -
Richard Feynman,
“What is Science?”
http://www.southerncrossreview.org/32/feynman3.htm -
Larry Woolf,
“How do scientists really do science?”
http://www.sci-ed-ga.org/pdfs/how-do-science-10-10-04.pdf
http://www.sci-ed-ga.org/pdfs/SDUHSD.pdf -
Richard Feynman,
The Pleasure of Finding Things Out
especially the chapter Cargo Cult Science. -
Martin Gardner,
Fads and Fallacies in the Name of Science 2nd edition (1957). -
John Denker,
“Truth in Contrast to Knowledge and Belief”
www.av8n.com/physics/truth.htm -
John Cook and Stephan Lewandowsky,
“The Debunking Handbook”
http://www.skepticalscience.com/docs/Debunking_Handbook.pdf -
John Denker,
“Principles of Teaching and Learning”
www.av8n.com/physics/pedagogy.htm -
John Denker,
”Valid versus Invalid Arguments: Appeal to Authority etc.”
www.av8n.com/physics/authority.htm -
John Denker,
“Argument from No Evidence”
www.av8n.com/physics/no-evidence.htm -
John Denker,
“Students Need the Best Evidence, Not the Most Ancient Evidence”
www.av8n.com/physics/best-evidence.htm -
Donald T. Campbell and Julian C. Stanley,
EXPERIMENTAL AND QUASI-EXPERIMENTAL DESIGNS FOR RESEARCH
http://jwilson.coe.uga.edu/EMAT7050/articles/CampbellStanley.pdf -
John Denker,
“The Twelve Coins Puzzle”
www.av8n.com/physics/twelve-coins.htm -
University of California Museum of Paleontology,
“Understanding Science – how science really works”
http://undsci.berkeley.edu/index.php
http://undsci.berkeley.edu/teaching/teachingtools.php -
John Denker,
“Definition of Weight, Gravitational Force, Gravity, g, et cetera”
www.av8n.com/physics/weight.htm -
John Denker,
“How To Evaluate Creative Ideas”
www.av8n.com/physics/projectology.htm -
John Denker,
“Changing One Variable at a Time ... or Not
www.av8n.com/physics/one-variable-at-a-time.htm -
A page from one of Linus Pauling’s lab books (with links
to many other pages),
http://scarc.library.oregonstate.edu/coll/pauling/rnb/05/05-020.html -
USPS Electronic Postmark Services
https://www.uspsepm.com/info/faq/faqs_general.html